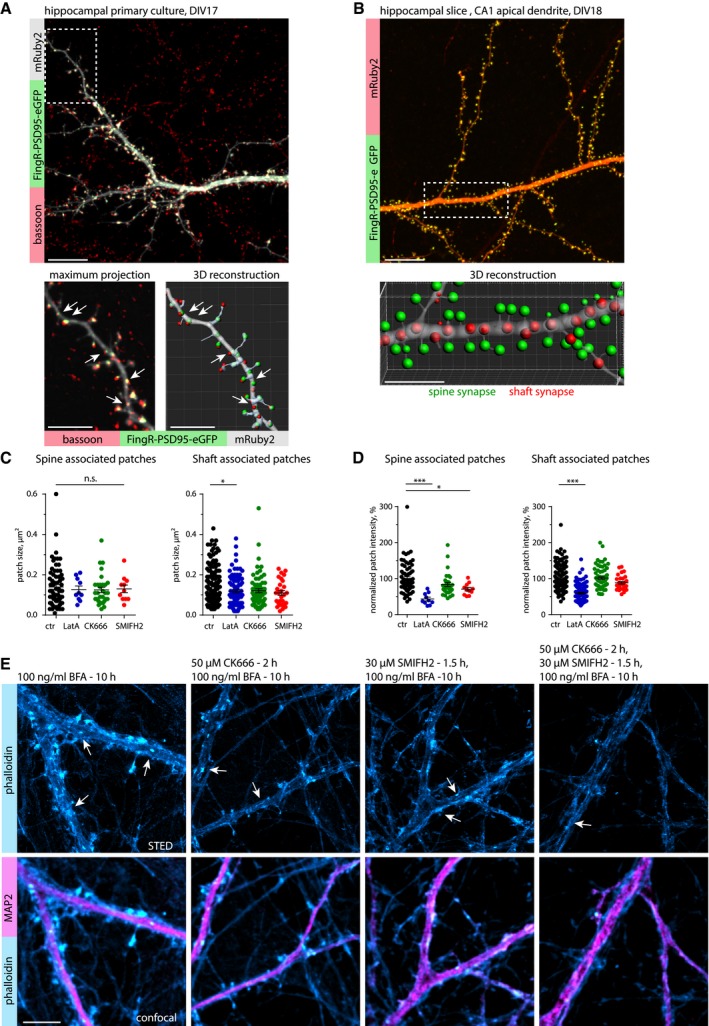
Upper panel: Maximum projection of a confocal image stack of a primary hippocampal neuron at DIV17, transfected with mRuby2 (cell fill) and FingR‐PSD95‐eGFP as an excitatory postsynaptic marker, and stained for bassoon as a presynaptic marker. Lower panel: Higher magnification image and corresponding 3D reconstruction show the presence of excitatory shaft synapses (arrows). Images are presented with a 1 px Gaussian blur filter. Scale bar: 10 μm, 5 μm.
Upper panel: Maximum projection of a confocal image stack displaying the apical dendrite of a CA1 pyramidal neuron in a hippocampal slice culture at DIV18, electroporated with mRuby2 (cell fill) and FingR‐PSD95‐eGFP as excitatory postsynaptic marker. Lower panel: 3D reconstruction demonstrated the presence of excitatory shaft synapses (red). Images are presented with a 1 px Gaussian blur filter. See also
Movie EV1. Scale bar: 10 μm, 5 μm (Zoom‐in).
Quantification of actin patch size in control (DMSO)‐, LatA (5 μM for 30 min)‐, CK666 (50 μM for 2 h)‐, and SMIFH2 (30 μM for 90 min)‐treated neurons. Patch size for spine‐associated patches is not significantly changed after treatment. The size of shaft‐associated patches was reduced after LatA treatment. One‐way ANOVA with Dunnett's post hoc test. *P = 0.02. n = 71 (ctr), n = 10 (LatA), n = 31 (CK666), and n = 11 (SMIFH2) spine‐associated patches and n = 151 (ctr), n = 95 (LatA), n = 68 (CK666), and n = 28 (SMIFH2) shaft‐associated patches in 24, 17, 12, and 6 dendrites of 16, 15, 10, and six cells in two independent cultures. Data are presented as mean ± SEM.
Quantification of normalized actin patch intensity as in (C). Normalized actin patch intensity for spine‐associated patches was reduced in LatA (5 μM for 30 min)‐ and SMIFH2 (30 μM for 90 min)‐treated groups. For shaft‐associated patches, it was only reduced after LatA treatment. One‐way ANOVA with Dunnett's post hoc test. *P = 0.03, ***P < 0.001. Same n as in (C). Data are presented as mean ± SEM.
Representative STED and confocal images of DIV18 primary hippocampal neurons treated with brefeldin A (BFA, 100 ng/ml for 10 h), a drug that disrupts endosomes. Neurons were stained with α‐MAP2 antibody and phalloidin‐Atto647N, and arrows indicate examples of actin patches. BFA treatment did not affect the number of actin patches, nor alter the effect of CK‐666 (Arp2/3 inhibitor) and SMIFH2 (formin inhibitor) on actin patches. Scale bar: 5 μm.

