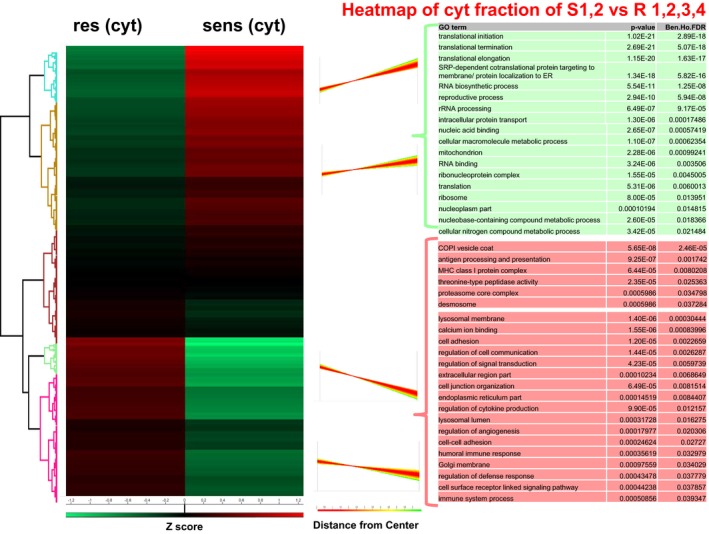
Figure EV2. Proteome characterization of sensitive (S1,2) and resistant (R1,2,3,4) melanoma cells (cytoplasmic fraction).

Left: Hierarchical clustering of Z‐scored expression values for significantly changed protein expression, revealing differences between sensitive and resistant cells. Right: Profiles of the four main clusters. Red: upregulated in resistant cells, green: downregulated in sensitive cells.
