-
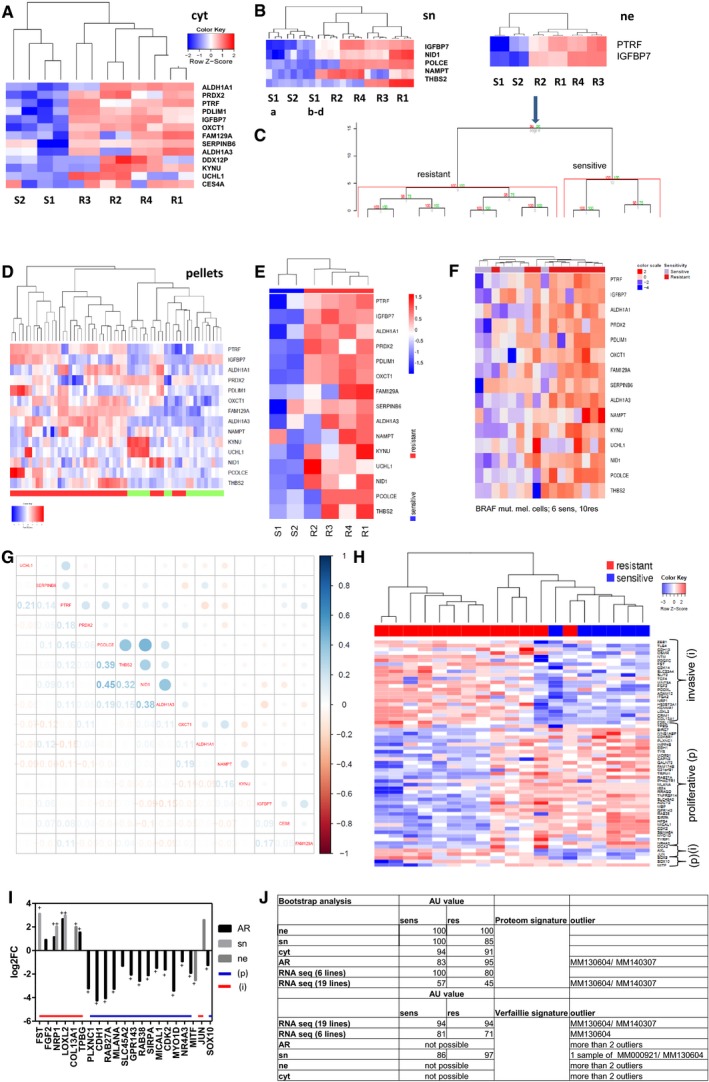
A–D
Proteins needed to distinguish between sensitive and resistant cells in cytoplasm (A), secretome (B) and nucleus with bootstrap analysis (C), of the 15 candidates in cell pellets (D).
-
E, F
Heatmap of the 15 candidates with RNAseq data of S1, S2 R1–4 and a second cohort.
-
G
Correlation matrix of the 15 candidates with TCGA, numbers indicate Pearson correlation coefficient.
-
H
Heatmap of Verfaillie signature with RNAseq data correlating invasive (i)/proliferative (p) phenotype with resistant/sensitive melanoma cell cultures.
-
I
Bar graph of 1st cohort (sn, ne) and 2nd cohort (AR; all resistant) correlating the Verfaillie signature of invasive (i) and proliferative (p) genes with the protein expression up or downregulated in resistant cell cultures.
-
J
Bootstrap analysis with AU value of 1st and 2nd proteome and RNA cohort versus proteome signature (15 proteins) and RNA signature of the Verfaillie publication, + multiparameter correction.

