-
A–D
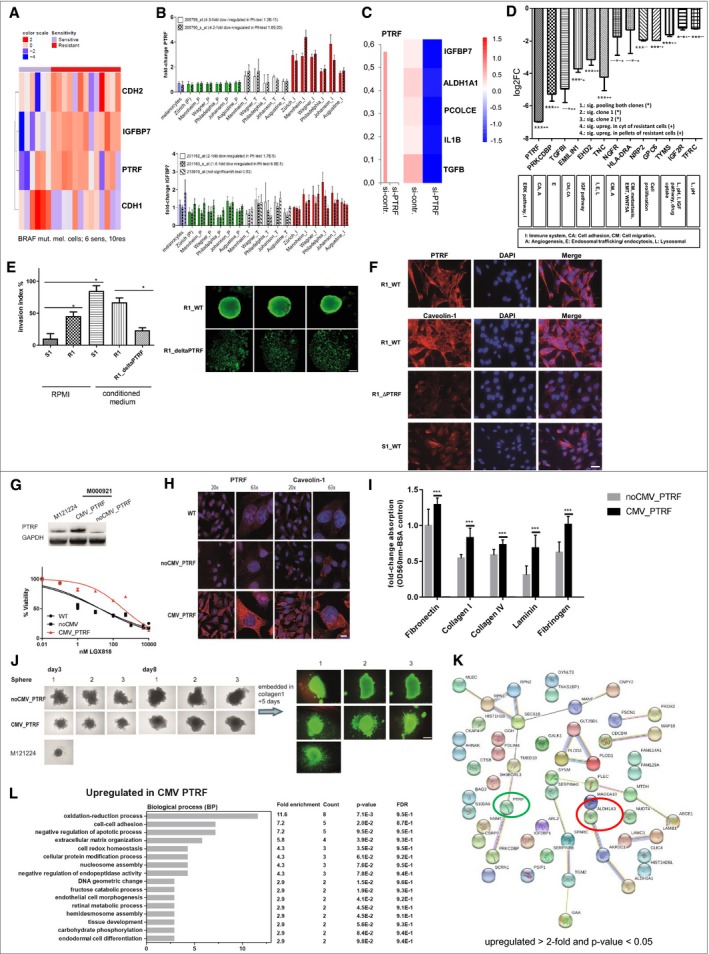
Association of PTRF and IGFBP7 with EMT phenotype (RNAseq data) (A) and with the invasive phenotype of melanoma cell cultures in microarray data of six different centres (B). (C) siRNA knockdown of PTRF and involved proteins by PTRF knockdown, Z values of the deltadeltaCT are used for the heatmap. (D) CRISPR of PTRF and the targets.
-
E
Cell invasion of S1 and R1 with and without supernatant of melanoma‐associated fibroblasts (conditioned medium), and R1 harbouring loss of PTRF by CRISPR/Cas (R1_ΔPTRF). Statistical analysis using a one‐tailed unpaired Student's t‐test to analyse significance of two groups (*< 0.05). Sphere formation of R1 and R1_ΔPTRF showing live fluorescent staining using Calcein AM (Thermo Fisher). Here we show pictures of three independent wells. Ruler: 200 μM.
-
F
Immunofluorescence analysis of PTRF and caveolin‐1 in S1, R1 and R1_ΔPTRF. Ruler: 50 μM.
-
G
The BRAF‐mutated and drug‐sensitive melanoma cell culture M000921 (S1) was transduced with a lentivirus containing a PTRF‐overexpressing construct (CMV_PTRF) or a non‐CMV control plasmid (noCMV_PTRF). Expression of PTRF was confirmed by Western blotting. Cells were subjected to dose‐escalating concentrations of the BRAFi LGX818, and cell viability was measured for each concentration in triplicates. Error bars indicate SD. Normalized data were used to calculate the IC50 values by GraphPad Prism software [WT 57 nM (95%CI 32–100 nM); noCMV_PTRF 41 nM (95%CI 26–65 nM) and CMV_PTRF 784 nM (95%CI 592–1,037)].
-
H
Fluorescent microscopy revealed coregulation of PTRF and caveolin‐1. Ruler: 20×: 30 μM, 63×: 10 μM.
-
I
Cell adhesion is enhanced in PTRF‐overexpressing cell cultures (S1) (CMV_PTRF) in comparison with control cell cultures (noCMV_PTRF). Each bar graph represents the mean of two independent experiments for each cell culture (±SD). We performed a one‐tailed unpaired Student's t‐test for each adhesion protein to analyse significance between control and PTRF‐overexpressing cells (***< 0.005).
-
J
Rapid spheroid formation is observed in PTRF‐expressing melanoma cultures which also show higher degree of invasion into a collagen 1 matrix compared to cell cultures lacking PTRF expression. Ruler: 500 μM.
-
K
STRING analysis (red circle) and nearest shrunken centroid (green circle) of proteome data CMV_PTRF versus noCMV_PTRF (upregulated > 2‐fold and P‐value < 0.05).
-
L
Functional annotation categories calculated in DAVID (DAVID Bioinformatics Resources) upregulated in CMV_PTRF. Fold enrichment values, count (genes involved in the term), P‐value and FDR (false discovery rate, calculated using the Benjamini–Hochberg procedure), listed next to the graph, were calculated using DAVID bioinformatics resources.

