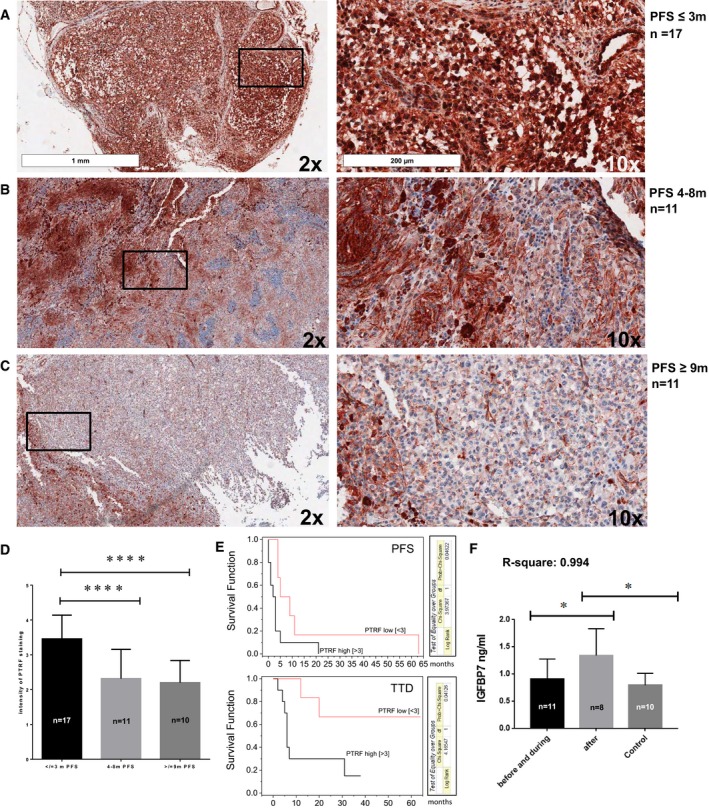
Figure 5. Clinical relevance of PTRF and IGFBP7 and drug activity.

-
A–D(A–C) Immunohistochemical staining for PTRF and (D) statistical analysis by one‐way ANOVA based on PFS. *P‐value < 0.05; **< 0.01, ***< 0.001.
-
EKaplan–Meier curves with hazard ratio correlating PFS and TTD (time to death) with PTRF expression.
-
FIGFBP7 analysis by one‐way ANOVA in the serum samples of patients with MAPKi therapy by ELISA. *P‐value < 0.05.
