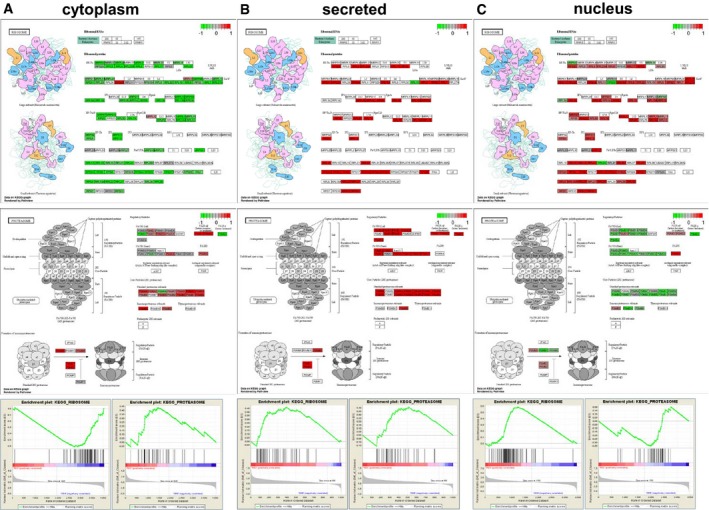
Figure EV5. GSEA (gene set enrichment analysis) and KEGG pathway visualization for the differential expression of ribosomal and proteasomal proteins KEGG pathway visualization of logFC regulated ribosomal and proteasomal proteins in cyt, sn and ne, red: upregulated green: downregulated in resistant cells.

