-
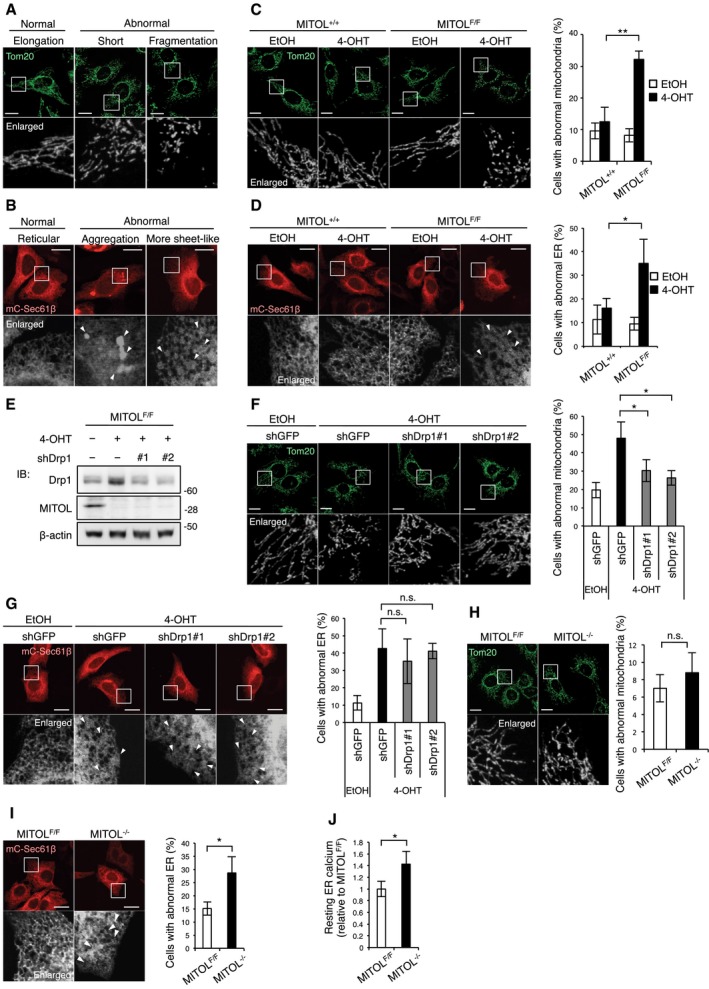
A, B
Morphological classification of mitochondria or the ER. The morphology of either mitochondria (A) or the ER (B) is classified as normal or abnormal. Mitochondrial network is visualized by anti‐Tom20 staining. To clarify the ER network, MEFs were transfected with mCherry‐Sec61β (mC‐Sec61β) 24 h prior to analysis. The lower panels show fivefold (A) or 4.5‐fold (B) magnification images of the boxed regions. Arrowheads indicate abnormal parts of the ER network.
-
C
Mitochondrial fragmentation induced by acute MITOL knockout. MITOL+/+ or MITOLF/F MEFs were treated with ethanol (EtOH) as control or 0.4 μM 4‐hydroxytamoxifen (4‐OHT) for 2 days, and then, MEFs were incubated in fresh medium for 2 days (A–E). All experiments using 4‐OHT below were performed at concentration of 0.4 μM. MEFs were immunostained with anti‐Tom20 antibody. The lower panels show fivefold magnification images of the boxed regions. Percentages of cells with abnormal mitochondria were calculated from 100 cells by visual inspection in each independent experiment. Scale bar represents 10 μm. Error bars represent SD (n = 3). **P < 0.01 (Student's t‐test). MITOL+/+: MITOL+/+, ERT2‐Cre, MITOLF/F: MITOLFlox/Flox, ERT2‐Cre.
-
D
Abnormal ER morphology induced by acute MITOL knockout. MEFs treated with EtOH or 4‐OHT were transfected with mC‐Sec61β 24 h before analysis. The lower panels show fivefold magnification images of the boxed regions. Arrowheads indicate abnormal parts of the ER network. Percentages of cells with abnormal ER were calculated from 50 cells by visual inspection in each independent experiment. Scale bar represents 10 μm. Error bars represent SD (n = 3). *P < 0.05 (Student's t‐test).
-
E, F
Effects of two shDrp1 on Drp1 expression and mitochondrial morphology in acute MITOL‐KO MEFs. MEFs treated with indicated reagents were transfected with each shDrp1 vector or shGFP 24 h before immunoblot analysis with indicated antibodies (E) or immunofluorescent analysis with anti‐Tom20 antibody (F). The lower panels show fivefold magnification image of the boxed regions. Percentages of cells with abnormal mitochondria were calculated from 50 cells by visual inspection in each independent experiment. Scale bar represents 10 μm. Error bars represent SD (n = 3). *P < 0.05 (Student's t‐test).
-
G
Drp1 repression did not resolve abnormal ER morphology in acute MITOL‐KO MEFs. MEFs treated with indicated reagents were transfected with both mC‐Sec61β and indicated shRNA vectors for 24 h before the observation of ER morphology. The lower panels show fivefold magnification image of the boxed regions. Arrowheads indicate abnormal ER. Percentages of cells with abnormal ER were calculated from 50 cells by visual inspection in each independent experiment. Scale bar represents 10 μm. Error bars represent SD (n = 3). n.s.: not significant (Student's t‐test).
-
H, I
Chronic knockout of MITOL exhibited abnormal ER morphology. Chronic MITOL‐KO MEFs were immunostained with anti‐Tom20 antibody (H). MEFs were transfected with mC‐Sec61β 24 h before analysis (I). The lower panels show fivefold magnification image of the boxed regions. Arrowheads indicate abnormal parts of the ER network. Percentages of cells with abnormal mitochondria or ER were calculated from 100 (H) or 50 cells (I) by visual inspection in each independent experiment. Scale bar represents 10 μm. Error bars represent SD (n = 3). *P < 0.05, n.s.: not significant (Student's t‐test).
-
J
Increased resting Ca2+ in the ER of MITOL‐KO MEFs. MEFs were transfected with G‐CEPIA1er, Ca2+ indicator for the ER, 24 h before analysis. Resting Ca2+ in the ER was calculated from 10 cells in each independent experiment as described in methods. Error bars represent SD (n = 3). *P < 0.05 (Student's t‐test).