
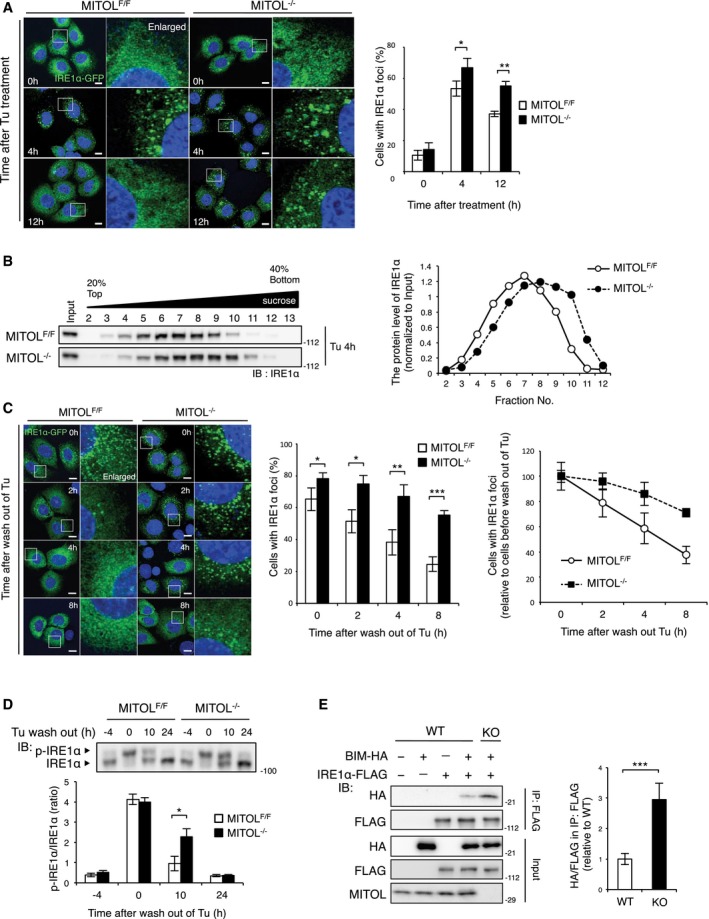
Figure 3. MITOL KO stabilizes IRE1α oligomers.
-
A, BMITOL KO facilitated IRE1α oligomerization. MEFs were transfected with IRE1α‐GFP expression vector for 24 h prior to Tu treatment for indicated periods (A). The right panels show fivefold magnification images of the boxed regions. Percentages of cells with IRE1α foci were calculated from 100 cells by visual inspection in each independent experiment (A). To evaluate the oligomerization level of endogenous IRE1α, cells without any transfection were solubilized and separated by sucrose density‐gradient centrifugation, followed by immunoblotting with anti‐IRE1α antibody (B). Scale bar represents 10 μm. Error bars represent SD (n = 4). *P < 0.05, **P < 0.01 (Student's t‐test).
-
CIRE1α oligomers were stabilized by MITOL KO. MEFs transfected with IRE1α‐GFP were treated with Tu. After 4 h, these cells were washed with PBS and subsequently re‐fed with fresh media for indicated periods. The right panels show fivefold magnification images of the boxed regions. Percentages of cells with IRE1α foci were calculated from 100 cells by visual inspection at indicated periods after wash out of Tu in each independent experiment. Scale bar represents 10 μm. Error bars represent SD (n = 3). *P < 0.05, **P < 0.01, ***P < 0.001 (Student's t‐test).
-
DSustained IRE1α autophosphorylation after wash out of Tu in MITOL‐KO MEFs. MEFs were treated with Tu for 4 h and washed with PBS and re‐fed with fresh media for indicated periods, followed by immunoblotting with anti‐IRE1α antibody after Phos‐tag SDS–PAGE. Error bars represent SD (n = 3). *P < 0.05 (Student's t‐test).
-
EMITOL deletion promoted the interaction between IRE1α and BIM under ER stress. MITOL‐depleted HEK293 cells (KO) were generated using CRISPR‐Cas9 system. Cells were co‐transfected with indicated vectors 24 h prior to Tu treatment for 12 h. Cells were immunoprecipitated with anti‐FLAG antibody, followed by immunoblotting with indicated antibodies. Error bars represent SD (n = 3). ***P < 0.001 (Student's t‐test).