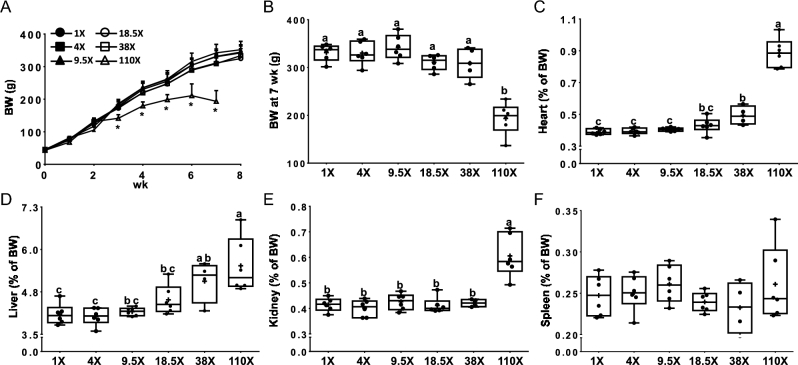
FIGURE 1.
Growth curves (A), BW at 7 wk (B), and relative heart (C), liver (D), kidney (E), and spleen (F) weights of male rats fed diets varying in iron concentration for 7–8 wk. All data points are shown, n = 4–6. *Different from the other dietary groups at that age, P < 0.05 (A). Labeled means without a common letter differ, P < 0.05 (B–F). BW, body weight.

