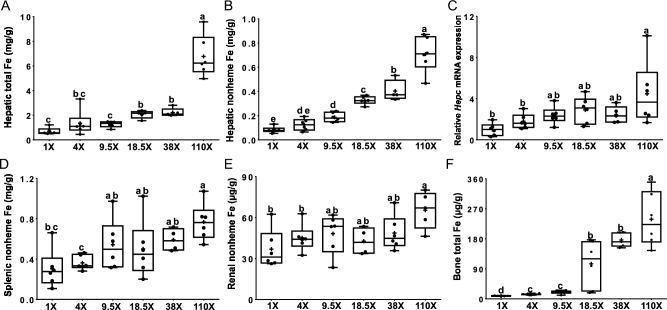
FIGURE 3.
Hepatic total iron (A), hepatic nonheme iron (B), hepatic Hepc mRNA expression (C), splenic nonheme iron (D), renal nonheme iron (E), and bone total iron (F) of male rats fed diets varying in iron concentration for 7–8 wk. All data points are shown, n = 4–6. Labelled means without a common letter differ, P < 0.05 Hepc, hepcidin.

