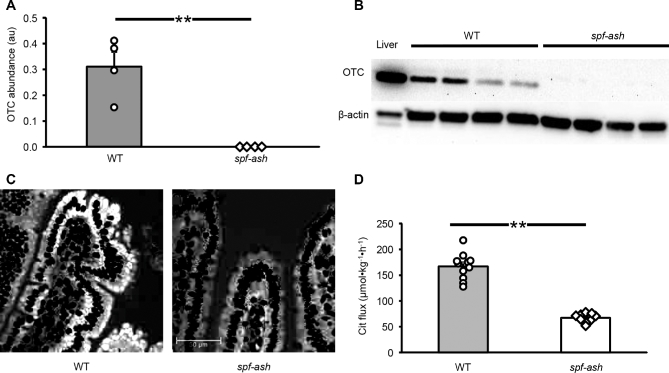
FIGURE 2.
Small intestine OTC abundance (A), Western blot (B), immunohistochemistry (C), and citrulline flux (D) in ICR WT and ICRspf-ash mice. A representative immunochemistry figure, presented here in black and white, has been manipulated to increase the contrast between the nuclei (in black) and the OTC protein (white). (A color figure is available as Supplemental Figure 3.) Values are means ± SEs; n = 4 for WT and spf-ash OTC abundance, n = 11 for WT, and n = 9 for spf-ash for citrulline flux. Individual values are also shown. **P < 0.001. au, arbitrary units; Cit, citrulline; ICR, Institute of Cancer Research; OTC, ornithine transcarbamylase; spf-ash, sparse fur and abnormal skin; WT, wild-type.

