
FIGURE 3.
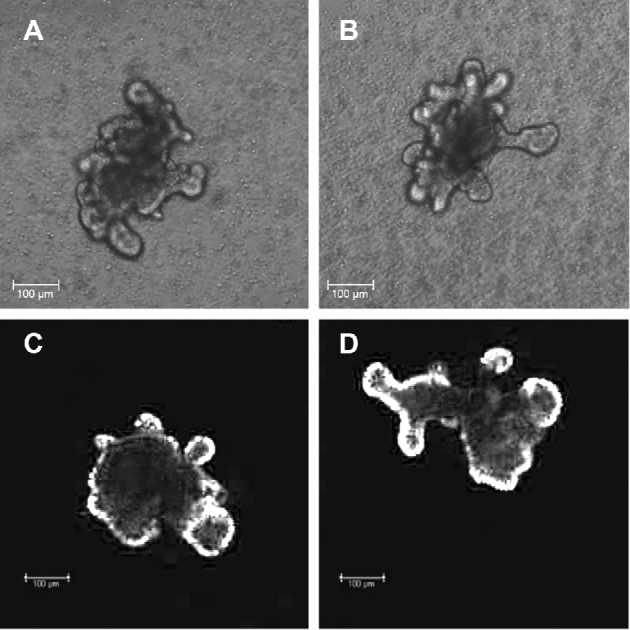
Enteroids derived from ICR WT (A, C) and ICRspf-ash (B, D) mice. Representative enteroid samples are shown using bright-field (A and B) and fluorescence (C and D) microscopy. The fluorescence microscopy figure, presented here in black and white, has been manipulated to increase the contrast of proliferating cells (in white). (A color figure is available as Supplemental Figure 4.) ICR, Institute of Cancer Research; spf-ash, sparse fur and abnormal skin; WT, wild-type.