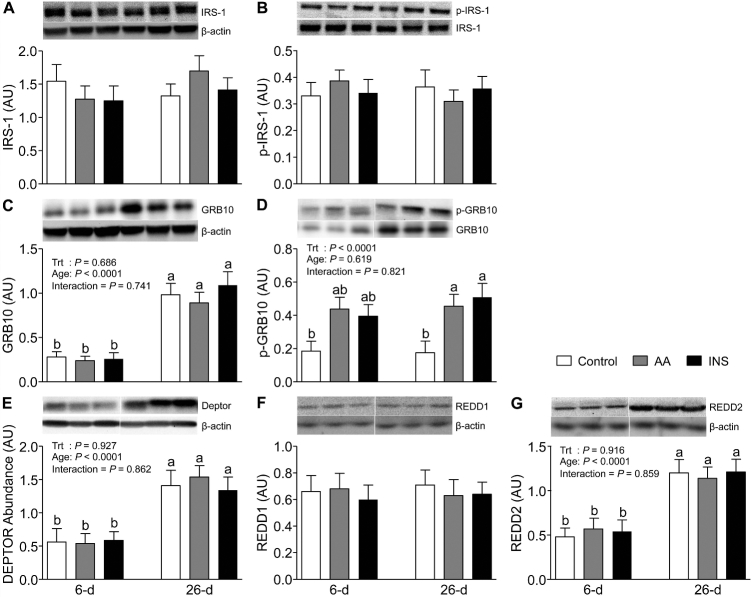
FIGURE 2.
The abundance of IRS-1 (A), phosphorylation of IRS-1 at Ser636/639 (B), abundance of GRB10 (C), phosphorylation of GRB10 at Ser501/503 (D), and abundance of DEPTOR (E), REDD1 (F), and REDD2 (G) in longissimus dorsi muscle of 6- and 26-d-old pigs after 2-h infusion of saline (control), amino acids, or insulin. The values for protein abundance were normalized by β-actin abundance. The phosphorylation values were corrected by their abundance in the samples. White lines between bands indicate where images from the same blots were spliced to adjust sample order on the membrane for presentation. Values are least square means ± SEM; n = 4–6. Means with uncommon letters are significantly different: a > b. P < 0.05 was considered significant. AA, amino acid group; AU, arbitrary unit; DEPTOR, DEP domain-containing mechanistic target of rapamycin-interacting protein; GRB10, growth factor receptor bound protein 10; INS, insulin group; IRS-1, insulin receptor substrate 1; p, phosphorylated; REDD, regulated in development and DNA damage response; Trt, treatment.

