
Figure 1.
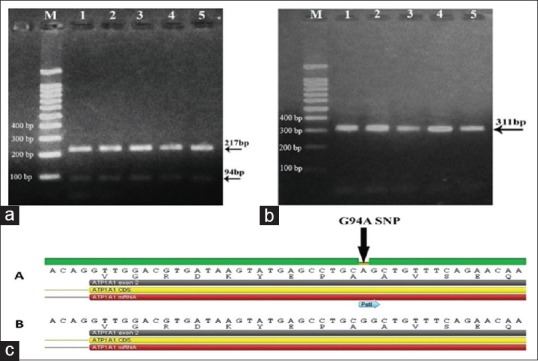
(a) PstI digestion of 5 ATP1A1 polymerase chain reaction products in diabetic groups shows digestion in all samples. M represents 1kb ladder. Lane 1 and 2; Group II (diabetic patients without complications). Lane 3, 4 and 5; Group III (patients with diabetic neuropathy). (b) PstI digestion of five ATP1A1 polymerase chain reaction products in control group shows no digestion. M represents 1kb ladder. (c) Gene sequencing for amplified ATP1A1 gene (311 bp) after purification. Synonymous G94A single nucleotide polymorphism. (A) diabetic groups and (B) control group (MG053109)