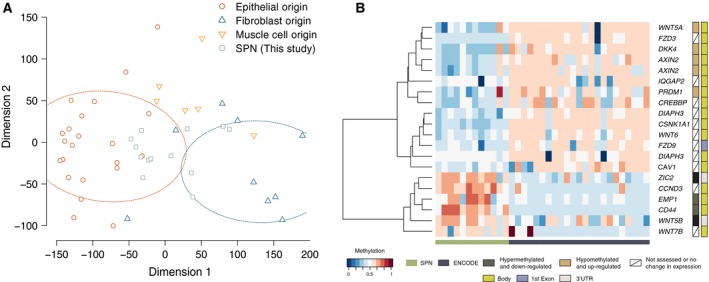
Figure 3.

Patterns of methylation in SPNs and normal tissue samples. (A) Principal component analysis of methylation data showing the clustering of samples of different histological origins from the ENCODE project together with SPNs profiled in this study. (B) Heatmap of methylation data from SPN samples profiled in this study and ENCODE samples of epithelial origin. Probes found to be differentially methylated (FDR < 0.1) between SPN and ENCODE samples were mapped to the Wnt pathway. With few exceptions, the probes mapped to gene bodies where hypomethylation corresponded to upregulation of the corresponding transcript. The two exceptions were probes mapping to ZIC2 and WNT5B which were located in 3′UTR regions where hypermethylation also corresponded to upregulation of the upstream gene.
