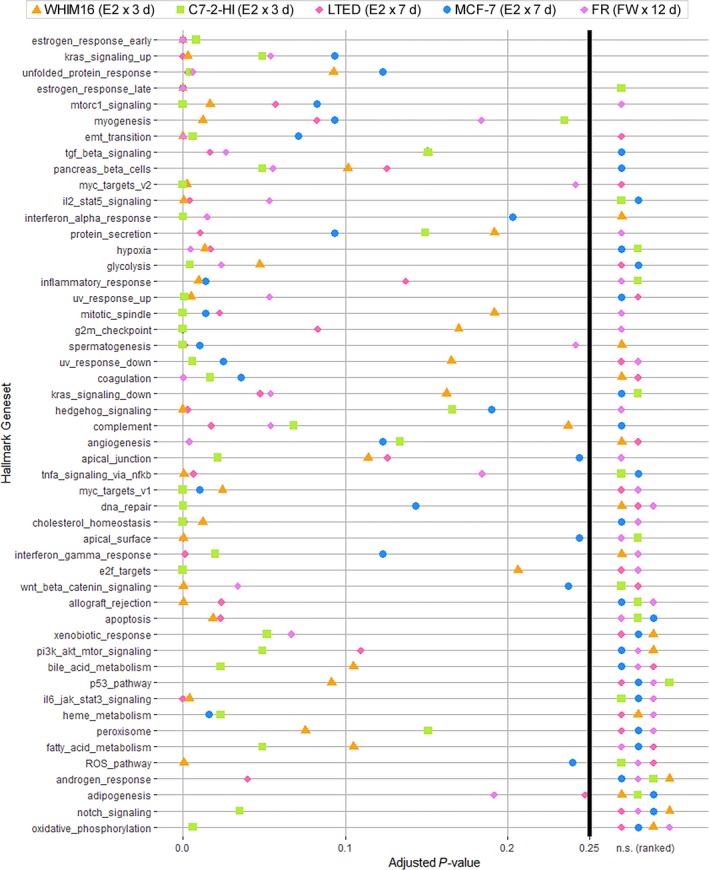
Figure 3.

Transcriptomic profiling reveals a UPR upon ER reactivation via E2 treatment or anti‐estrogen withdrawal. RNA was extracted from WHIM16 and C7‐2‐HI tumors from mice treated ± E2 (via s.c. pellet) for 3 days, from MCF‐7 and LTED cells treated ± 1 nm E2 for 7 days, and from FR cells treated ± FW for 12 days, all in triplicate. FR cell RNA was analyzed by gene expression microarray. RNA from other samples was analyzed by sequencing. Whole‐transcriptome expression profiles of E2‐treated and FW‐treated samples compared to baseline were analyzed by unsupervised sample‐wise enrichment analysis using the hallmark geneset collection in GSVA. Adjusted P‐values below the significance threshold of 0.25 (Subramanian et al., 2005) are shown, and nonsignificant (n.s.) P‐values are ranked at right.
