
Figure 1.
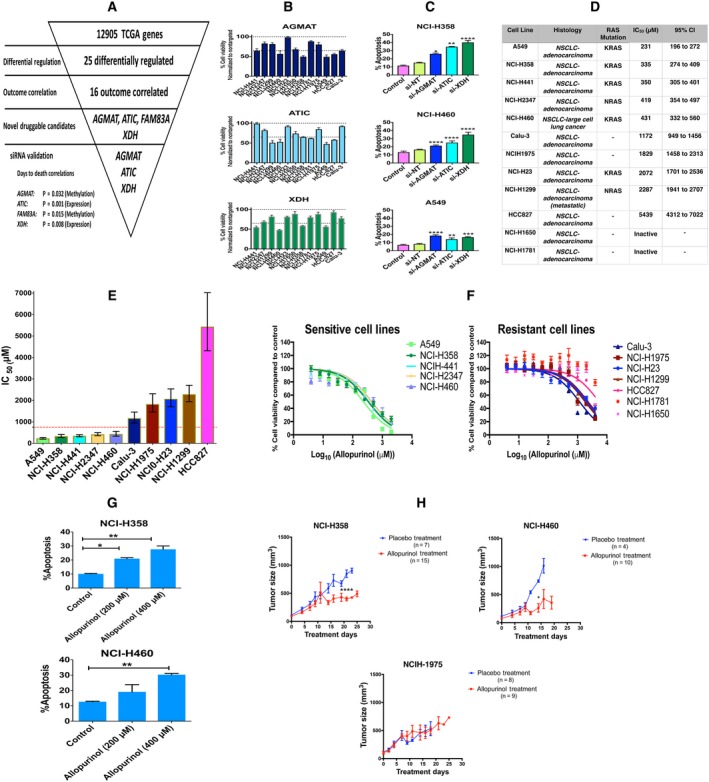
(A) Analysis of 12 905 genes in TCGA led to finding 25 differentially regulated genes in patients with LUAD; of these genes, 16 correlated with clinical outcome. Four of these 16 genes were novel druggable genes, and three of them were selected for siRNA knockdown validation. (B) siRNA knockdown validation of three gene targets in 12 NSCLC cell lines; the results are shown as percent cell viability (mean ± SEM). (C) Percent of apoptosis in cells (expressed as percent of annexin V‐positive cells) induced by siRNA knockdown of these three gene targets in three NSCLC cell lines (mean + SEM). siRNA knockdown increased apoptosis compared to control. (one‐way ANOVA, *P < 0.05, **P < 0.01, ***P < 0.001, ****P < 0.0001). (D) List of 12 cell lines, their histology, their RAS mutation status, the allopurinol IC50 for reduction of viability and its 95% confidence interval. (E) Comparing allopurinol IC50s in the different cell lines (error bars are 95% confidence intervals). An IC50 < 754 μm (red dotted line) was chosen as the criterion for considering a cell sensitive to allopurinol. (F) Log concentration–response plots for cell lines sensitive to and resistant to allopurinol. (mean ± SEM). (G) Allopurinol‐induced apoptosis (expressed as percent of annexin V‐positive cells) in NCI‐H358 and NCI‐H460 cell lines in a concentration‐dependent manner (mean + SEM, one‐way ANOVA, *P < 0.05, **P < 0.01). (H) Xenograft models were used to assess the effect of allopurinol on two cell lines sensitive to allopurinol (NCI‐H358 and NCI‐H460) and one cell line resistant to allopurinol (NCI‐H1975). Allopurinol (200 mg·kg−1) was administered by oral gavage three times a week to treatment groups (n = 15 for NCI‐H358, n = 10 for NCI‐H460, and n = 8 for NCI‐H1975) and PBS by oral gavage to the placebo groups (n = 7 for NCI‐H358, n = 4 for NCI‐H460, and n = 9 for NCI‐H1975). The tumor size in mice bearing NCI‐358 and NCI‐H460 cells and receiving allopurinol was significantly decreased compared to placebo at days 23 and 14, respectively. (mean ± SEM, unpaired t‐test, *P < 0.05, ****P < 0.0001) Allopurinol did not have any significant effect on tumor size of mice bearing NCI‐H1975 cells.