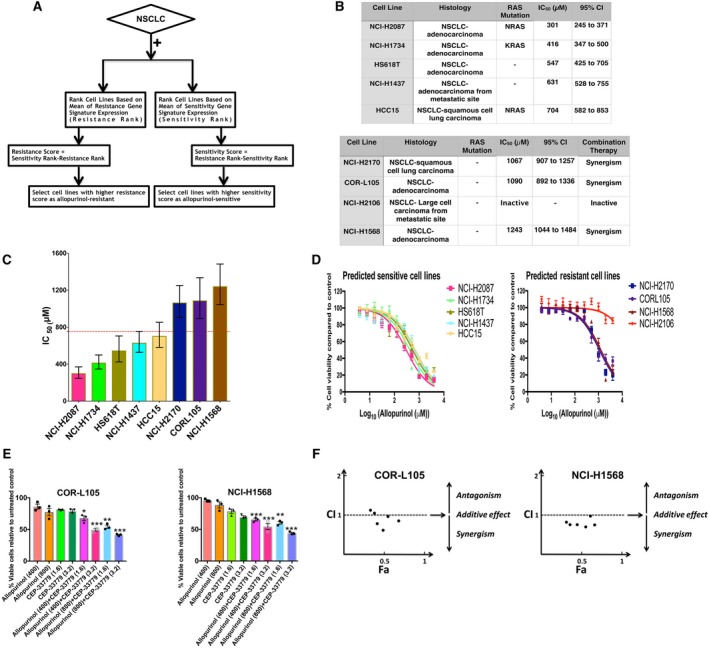
Figure 4.

(A) Flowchart describing the process of selecting new cell lines as allopurinol‐sensitive and allopurinol‐resistant. (B) List of predicted cell lines, their histology, RAS mutation status, calculated IC50 for allopurinol and its 95% confidence interval. (C) IC50 comparison for the predicted cell lines shown as mean ± SEM; error bars are 95% confidence intervals. The IC50 cutoff to determine sensitive and resistant cells was considered to be 755 μm (red dotted line). (D) Concentration–response curves for allopurinol treatment in predicted sensitive and resistant cell lines (mean ± SEM). (E) Effects of combination treatment with allopurinol and CEP‐33779 on two cell lines predicted as resistant (COR‐L105 and NCI‐H1568). Combination therapy significantly decreased cell viability compared to treatments with allopurinol alone. Percent of cell viability compared to vehicle control is shown. (mean + SEM, one‐way ANOVA, *P < 0.05, **P < 0.01, ***P < 0.001). (F) CI for different concentrations of allopurinol and CEP‐33779 in COR‐L105 and NCI‐H1568 cell lines; most of the combinations showed synergistic effects (CI < 1).
