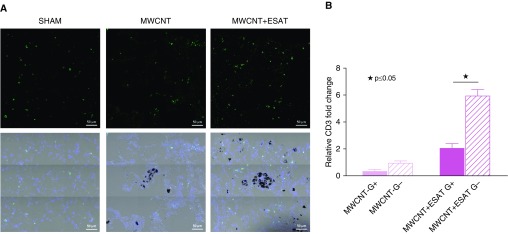
Figure 4.
CD3+ T cells are increased in PPARγ-KO mice instilled with MWCNT + ESAT-6. (A) Immunofluorescent anti-CD3 staining of lung tissues shows CD3+ cells around the granulomatous region and not within the granuloma itself. Scale bars: 50 μm. (B) Laser capture microdissection from lungs of PPARγ-KO mice also shows increased expression of CD3 mRNA in granuloma-negative compared with granuloma-positive regions within the same lung. Reported are the mean ± SEM values for five lungs from each group. ★P ≤ 0.05.

