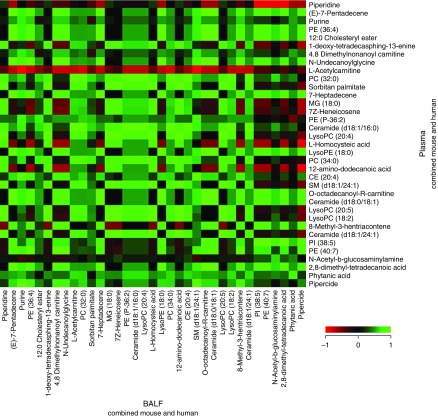
Figure 3.
Metabolite correlations across BAL fluid (BALF) and plasma. Data from the mouse and human BALF and plasma samples were combined to identify metabolites that correlated across both biofluids using Spearman rank correlation. From among 298 annotated metabolites, a subset of 35 metabolites was selected on the basis of their detected high abundances in BALF and plasma. Red indicates a negative correlation (r = −1) across BALF and plasma; green indicates a positive correlation (r = +1) between BALF and plasma; and black indicates no correlation (r = 0) between BALF and plasma. CE = cholesterol ester; LysoPC = lysophosphatidycholine; LysoPE = lysophosphatidylethanolamine; MG = monoglycerides; PC = phosphotidylcholines; PE = phosphotidylethanolamines; PI = phosphotidylinositol; SM = sphingomyelins.

