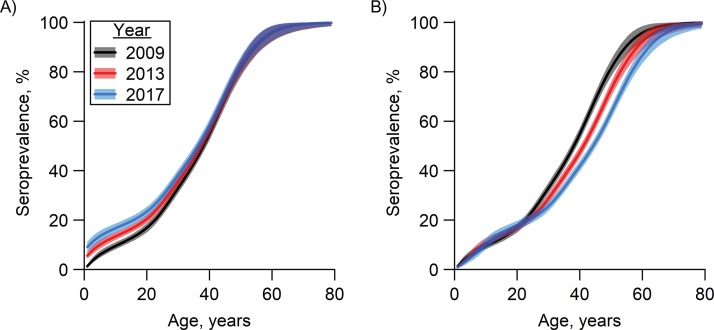
Figure 4.
Dengue seroprevalence by age and year among residents of Singapore, generated with Bayesian modeling, 2009, 2013, and 2017. Lines represent posterior median values for seroprevalence, and shaded areas represent 95% Bayesian credible intervals. A) Seroprevalence in the years 2009, 2013, and 2017 based on age in 2009. Within each birth cohort, only a marginal increase in seroprevalence is observable from 2009 to 2013 and from 2013 to 2017. The gap is most prominent in the youngest age group. B) Seroprevalence in the years 2009, 2013, and 2017 based on age in 2009, 2013, and 2017, respectively. Holding age fixed (in 2009, 2013, and 2017), the estimated prevalence for persons over age 23 years was lower in 2013 than in 2009 and lower in 2017 than in 2013.

