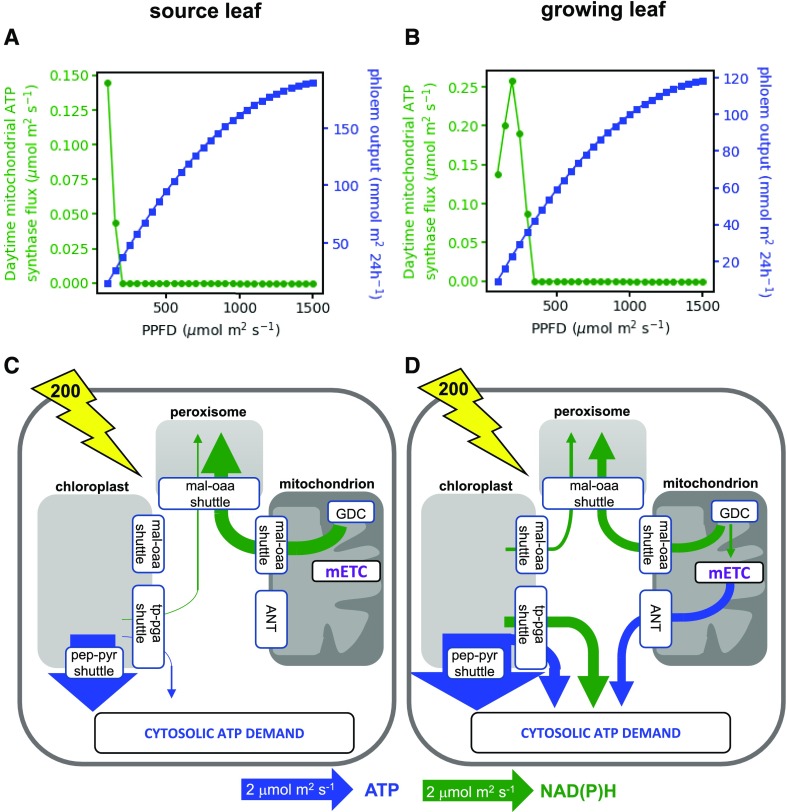
Figure 4.
Daytime energy shuttling between organelles in models of source and growing leaves. A and C, Source leaf. B and D, Growing leaf. A and B, Flux of mitochondrial ATP synthase (green) and diel model output (blue) at a range of light intensities (PPFD). C and D, Schematic of key fluxes transferring ATP or NAD(P)H between subcellular compartments at a PPFD of 200 μmol m−2 s−1 (indicated by the yellow lightning bolt arrow). The widths of the arrows are scaled relative to the flux as indicated under the diagram. Blue arrows are fluxes that involve ATP, and green arrows are those that involve NAD(P)H. For more details of the metabolite shuttles, see Figure 2. Abbreviations are as in Figure 2; ANT, adenine nucleotide translocase; GDC, Gly decarboxylase.

