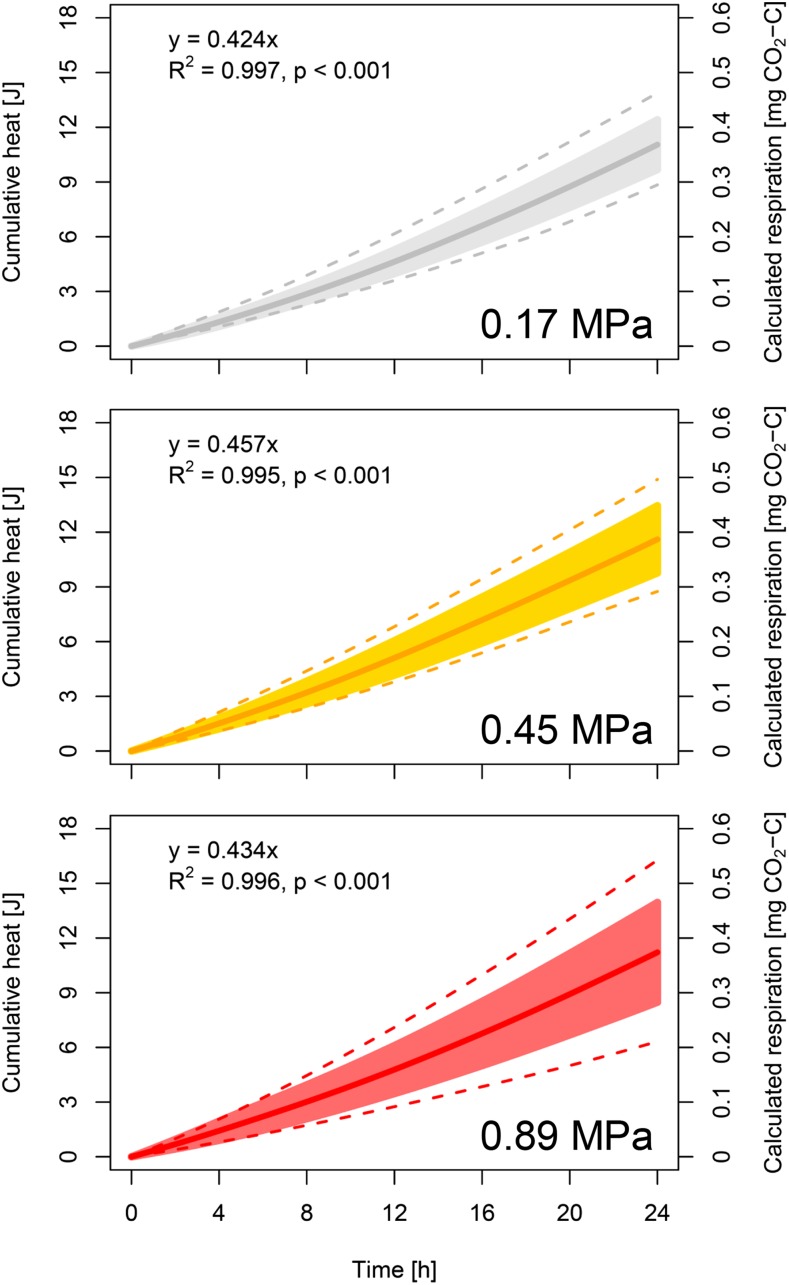
Figure 1.
Cumulative heat output, quantified using isothermal calorimetry, during 24 h of wheat root growth. Continuous line and shaded area represent mean value and sd of 16 genotypes, respectively, at low (0.17 MPa), moderate (0.45 MPa), and high (0.89 MPa) soil penetration resistance. Dashed lines represent genotypes with the lowest and highest cumulative heat output. Cumulative respiration was calculated assuming a calorespirometric ratio of 30 kJ g−1 CO2-C. Presented data are based on genotype mean values (n = 5).

