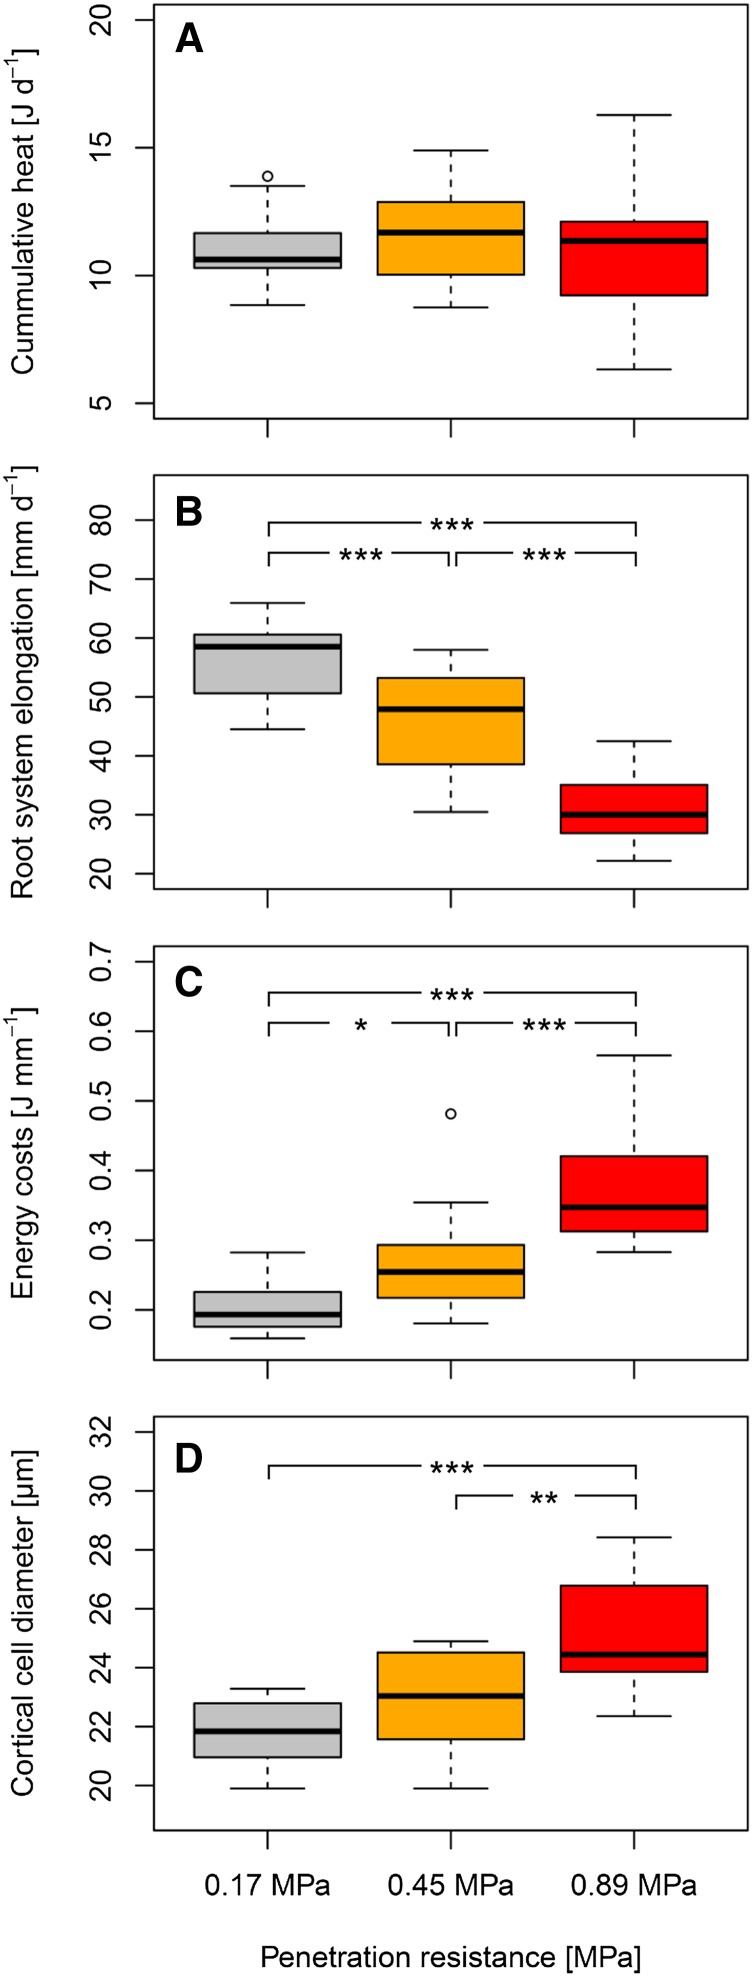
Figure 2.
Effects of soil penetration resistance on wheat root traits after 24 h of growth. A–D, Boxplots for cumulative heat output (A), daily root system elongation (B), energy costs of root elongation (C), and root cortical cell diameter (D) are based on mean values (n = 5) of 16 genotypes. ***, **, and * denote significant differences between soil penetration resistance levels using Tukey´s honest significance test at P < 0.001, P < 0.01, and P < 0.05.

