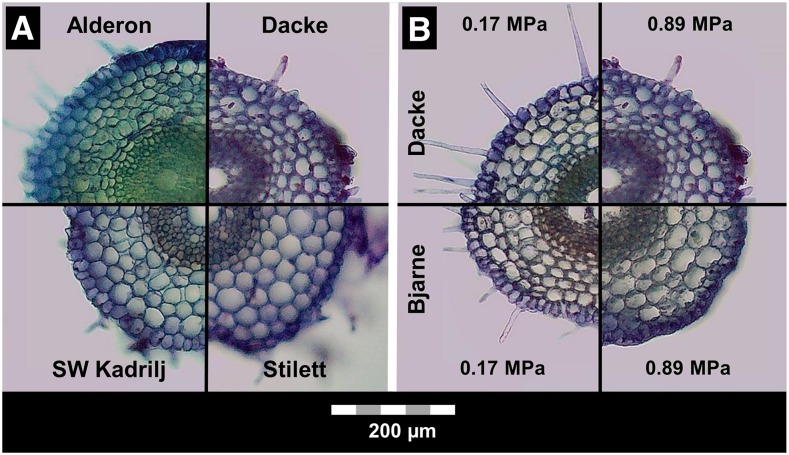
Figure 3.
Typical wheat root cross sections that were taken from the middle of primary roots between the apex and the base and stained for 1 min with 0.1% (m/v) Toluidine blue. A, Genotypic diversity in cortical cell diameter at high soil penetration resistance (0.89 MPa). B, Phenotypic plasticity in cortical cell diameter in response to an increase of soil penetration resistance from 0.17 MPa to 0.89 MPa.

