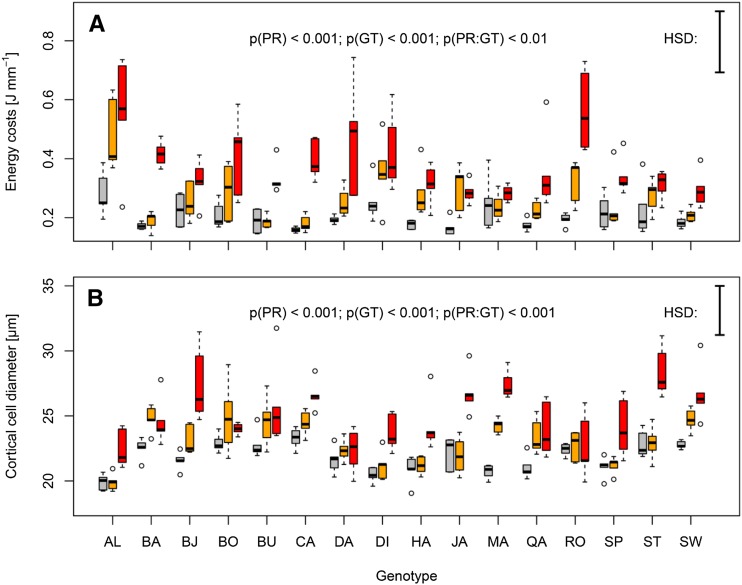
Figure 4.
Interaction effects of soil penetration resistance and genotype on wheat root traits after 24 h of growth. A and B, Boxplots show energy costs of root elongation (A) and root cortical cell diameter (B) under low (0.17 MPa, gray), moderate (0.45 MPa, orange), and high (0.89 MPa, red) soil penetration resistance in 16 genotypes. P values refer to ANOVA with penetration resistance (PR), genotype (GT), and their interaction (PR:GT) as explanatory factors. Vertical bars represent Tukey’s honest significant difference at P < 0.05 (n = 5). Genotype abbreviations and names are provided in Supplemental Table S6.

