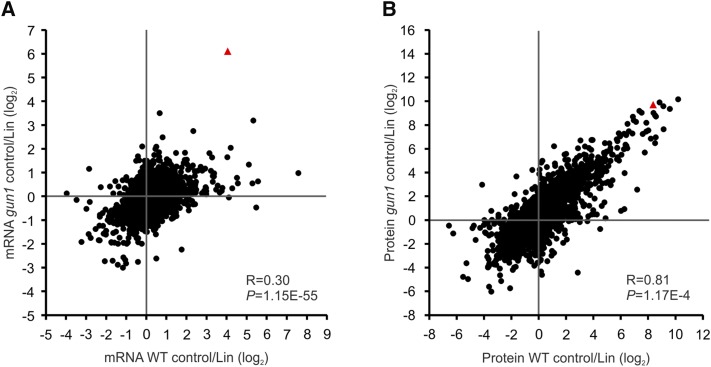
Figure 2.
Transcript and protein coanalysis reveals extensive translational and posttranslational regulation in retrograde signaling. Scatterplots show the high correlation of gene regulation at the protein level (B) compared with the transcript (mRNA) level (A) between the gun1 mutant and the wild type (WT) in response to Lin treatment. All nucleus-encoded genes whose protein products can be detected by mass spectrometry (MS; in a total of 5,449 genes; for details, see “Materials and Methods”) were included in the analysis. The fold changes in the Lin treatment relative to the untreated control (log2; averaged from three biological replicates) were compared between gun1 and the wild type to calculate the Pearson correlation coefficient (R) and the P value (P). Red triangles indicate the LOX2 gene.

