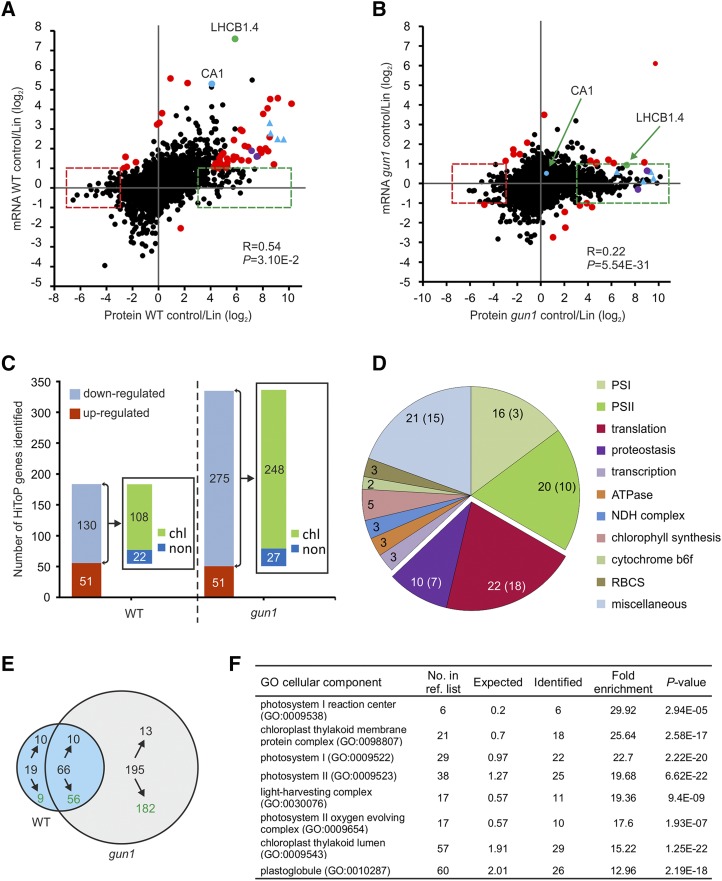
Figure 3.
HiToP genes identified. A and B, Scatterplots to compare the correlation of regulation between transcripts and proteins in control conditions versus Lin treatment in the wild type (WT; A) and the gun1 mutant (B). The HiToP genes were classified into two types: type I, log2 protein control/Lin > 3 or < −3 and −1 < log2 mRNA control/Lin < 1 (green and red dashed boxes); type II, log2 mRNA control/Lin > 1 or < −1 but log2 superratio of protein fold change to mRNA fold change of control to Lin treatment > 3 or < −3 (highlighted as red dots, purple dots, and blue triangles). Selected genes of special interest are marked: green dots, LHCB1.4; blue dots, CA1; purple dots, RBCS1B and RBCS3B (also identified as type II HiToP genes in the wild type); blue triangles, other examples of genes that were identified as type II HiToP genes in the wild type but as type I HiToP genes in gun1 (PsaG, PsaL, PsaD, and CaSR). See text for details. C, Up- and down-regulated HiToP genes identified in the wild type and the gun1 mutant. The numbers in the bars give the numbers of genes identified in each group. The insets show the number of HiToP genes that are down-regulated at the protein level upon Lin treatment and whose products are localized in chloroplasts (chl) or outside of chloroplasts (non). D, Pie chart illustrating the functional categories of the 108 plastid-localized HiToP proteins that are down-regulated in the wild type at the protein level upon Lin treatment. The numbers give the total number of genes identified in each functional category, while the numbers in parentheses denote the number of type I HiToP genes. The genes related to translation and proteostasis are separated out. E, Venn diagram illustrating the overlap of down-regulated type I genes (green boxes in A and B) between the wild type and the gun1 mutant. Green numbers indicate the number of genes whose protein products localize to plastids. F, GO enrichment of cellular component analysis of the 182 plastid-localized down-regulated type I HiToP genes in gun1. The 5,449 proteins identified by MS were used as the reference list for GO terms of enrichment analysis (http://www.pantherdb.org/). The fold enrichment was calculated by binomial test using the Bonferroni correction for multiple testing. The column “No. in ref. list” indicates the number of genes in each GO term among the 5,449 reference genes. The columns “Expected” and “Identified” indicate the number of genes that were expected or identified for each GO term within the 182 plastid-localized down-regulated type I HiToP genes.

