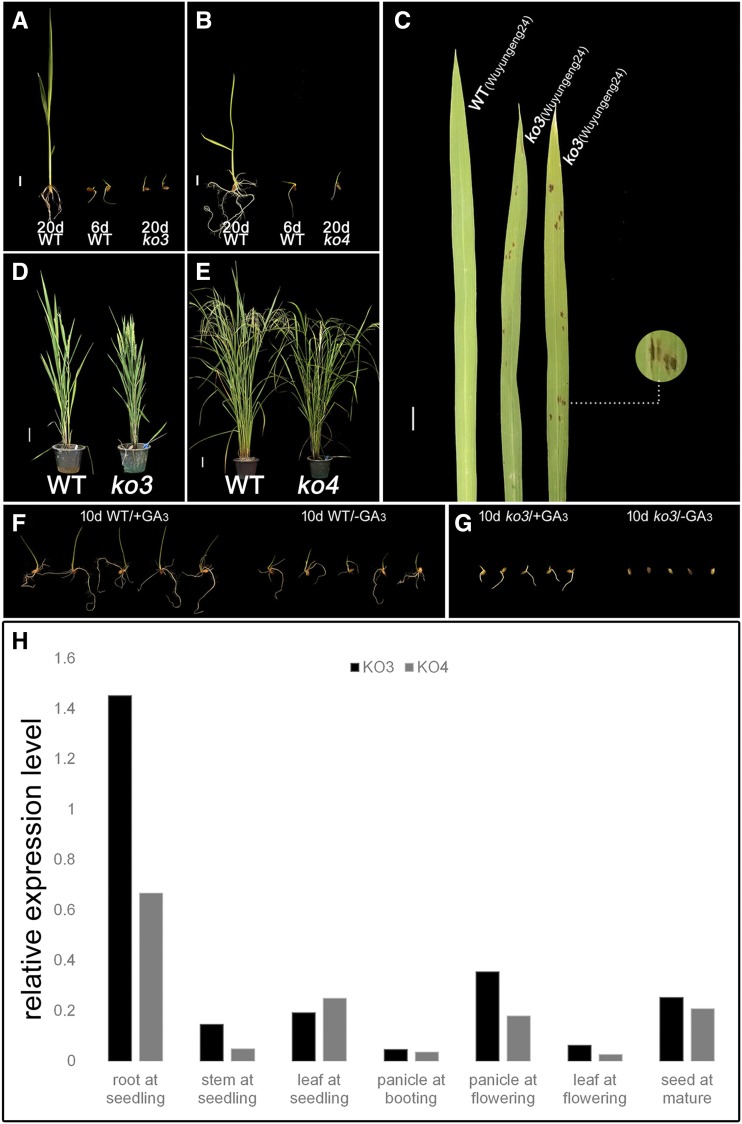
Figure 3.
Analysis of KO lines from Clade II. A, Delayed germination of osko3 and −4. Scale bar = 1 cm. B, Delayed germination of osko3 and −4. Scale bar = 1 cm. C, Infection scabs on leaves of osko3. Scale bar = 1 cm. D and E, Similar phenotypes of 4-month–old (D) osko3 and (E) osko4 compared to wild type. Scale bar = 10 cm. F and G, 150 mg/L GA3 application complementation experiment of (F) wild type and (G) osko3. H, Expression of Clade II KO genes in different tissues. The data are means of three replicates.

