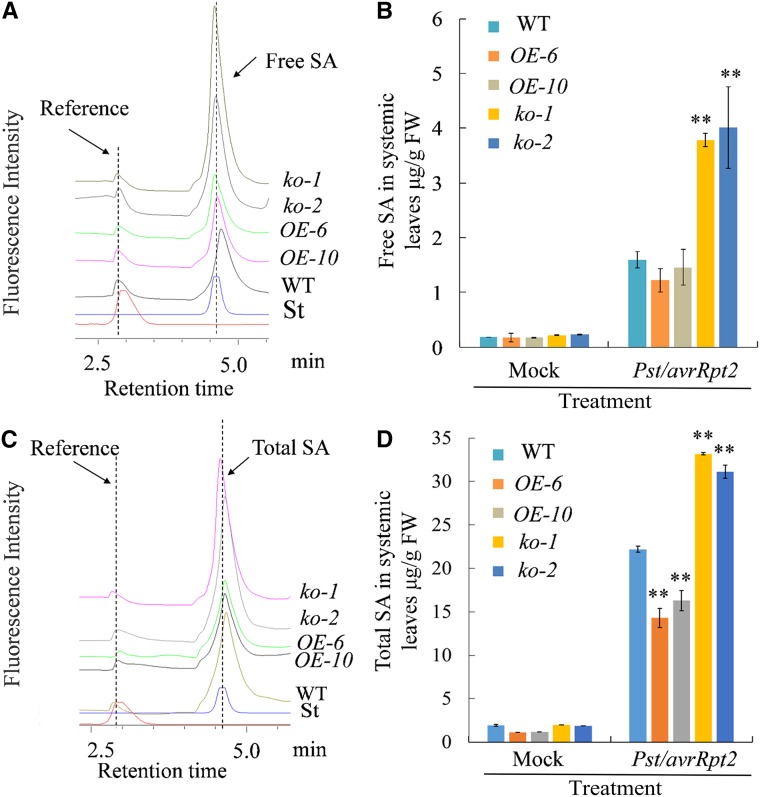
Figure 7.
Profiling of SA contents in mutant lines and overexpression lines during SAR. A, HPLC profiling of free SA levels in upper leaves of wild type, mutant lines (ko-1 and ko-2), and overexpression lines (OE-6 and OE-10) 48 h after inoculation of lower leaves with Pst /avrRpt2. B, Quantification of free SA levels in upper leaves of wild type, mutant lines, and overexpression lines 48 h after inoculation of lower leaves with 10-mm MgCl2 (Mock) or Pst/avrRpt2. C, HPLC profiling of total SA levels in upper leaves of wild type, mutant lines (ko-1 and ko-2), and overexpression lines (OE-6 and OE-10) 48 h after inoculation of lower leaves with Pst /avrRpt2. D, Quantification of total SA levels in upper leaves of wild type, mutant lines, and overexpression lines 48 h after inoculation of lower leaves with 10 mm MgCl2 (Mock) or Pst /avrRpt2. “St” represents the authentic standard of SA. All experiments were repeated three times with similar results. Data are means ≥ sd (Student’s t test, **P < 0.01). WT, wild type.

