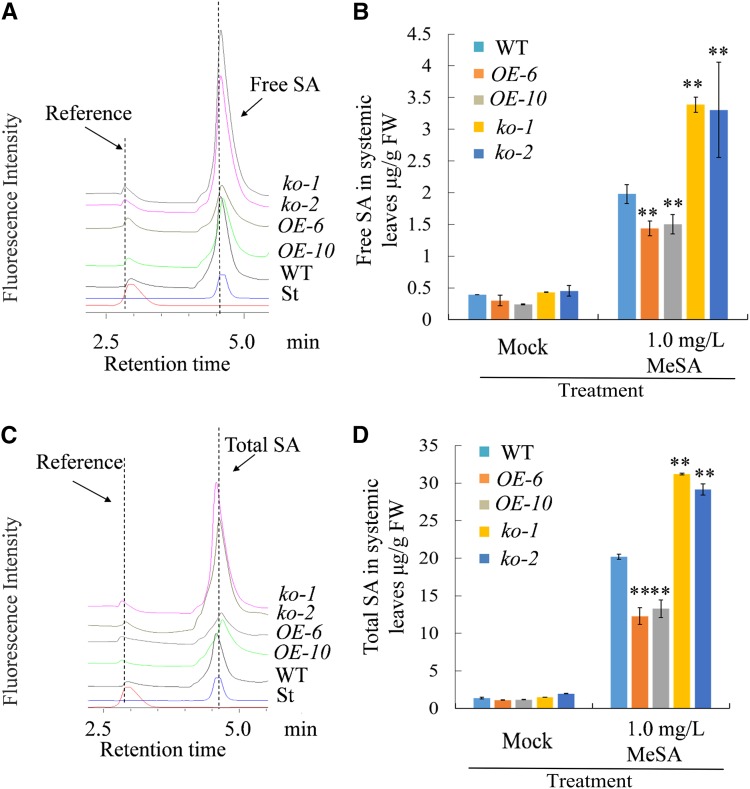
Figure 8.
Profiling of SA contents in mutant lines and overexpression lines after treatment with MeSA. A, HPLC profiling of free SA levels in upper leaves of wild type, mutant lines (ko-1 and ko-2), and overexpression lines (OE-6 and OE-10) 48 h after inoculation of lower leaves with 1 mg/L MeSA. B, Quantification of free SA levels in upper leaves of wild type, mutant lines, and overexpression lines 48 h after inoculation of lower leaves with 1 mg/L MeSA or DMSO solvent (Mock). C, HPLC profiling of total SA levels in upper leaves of wild type, mutant lines (ko-1 and ko-2), and overexpression lines (OE-6 and OE-10) 48 h after inoculation of lower leaves with 1 mg/L MeSA. D, Quantification of total SA levels in upper leaves of wild type, mutant lines, and overexpression lines 48 h after treatment of lower leaves with 1 mg/L MeSA or DMSO solvent (Mock). “St” represents the authentic standard of SA. All experiments were repeated three times with similar results. Data = means ≥ sd (Student’s t test, **P < 0.01). WT, wild type.

