Figure 3.
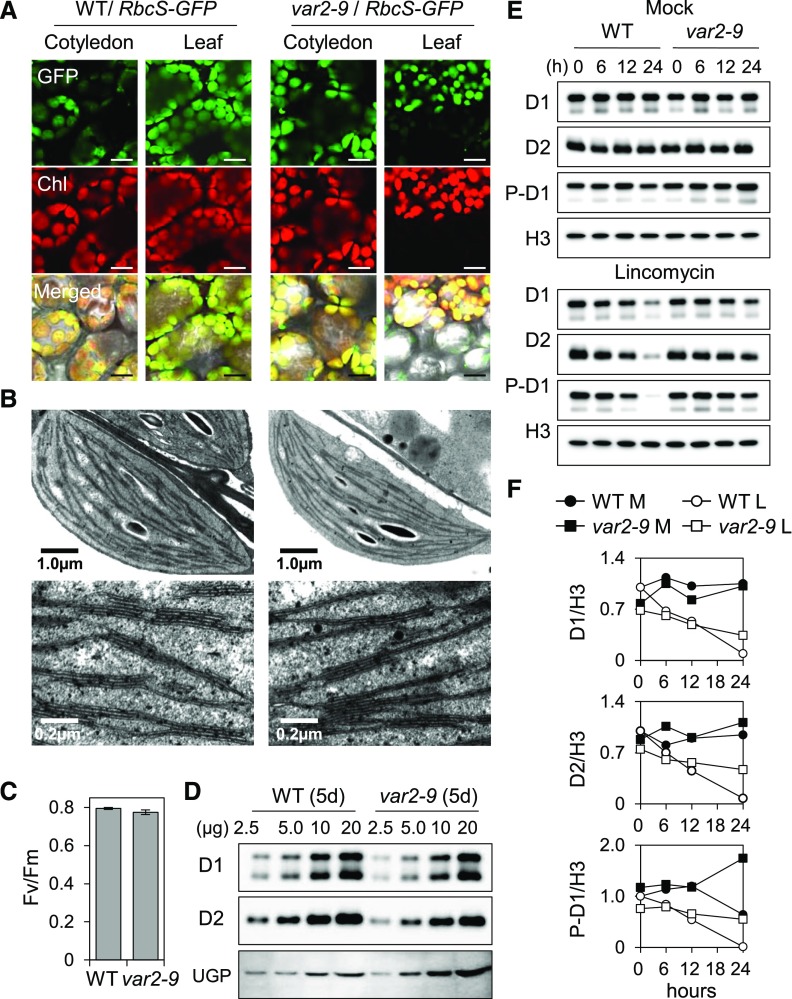
Impaired PSII proteostasis in cotyledons of var2-9 seedlings. Seedlings grown on Murashige and Skoog agar medium under CL (40 μmol m−2 s−1 at 22°C ± 2°C) were used. A, To compare the size and morphology of chloroplasts, 10-d-old transgenic wild-type (WT) and var2-9 seedlings expressing the Rubisco small subunit (RbcS) fused with a GFP tag under the control of the cauliflower mosaic virus (CaMV) 35S promoter were monitored by confocal microscopy. The selected area of the detached true leaf of the var2-9 mutant shows discrete signals of both the chlorophyll fluorescence and GFP because of the leaf variegation. The green fluorescence of GFP and red fluorescence of chlorophyll (Chl) were monitored separately. Bars = 25 μm. B, Characteristic ultrastructures of chloroplasts observed in the var2-9 cotyledons (left) and in the wild type (right). Top and bottom images show intact chloroplasts and the thylakoid membrane system in a granum, respectively. C, PSII activity (Fv/Fm) in 5-d-old wild-type and var2-9 seedlings. Results represent means from three independent measurements. For each measurement, at least 20 seedlings were analyzed. Error bars indicate sd. D, The steady-state levels of the D1 and D2 proteins in 5-d-old var2-9 and wild-type seedlings were determined by immunoblot analysis. The numbers on the top indicate the amount of proteins loaded on each lane. UGPase (UGP) was used as a loading control. E, Relative degradation rates of D1, D2, and phosphorylated D1 (P-D1) in 5-d-old wild-type and var2 seedlings in the absence (top) or presence (bottom) of 5 mm lincomycin. At the various indicated time points, total protein was extracted and the relative levels of D1 and D2 were probed by immunoblot analysis. Histone H3 (H3) was used as a loading control. F, The immunoblot signals in E from three independent biological replicates were quantified using ImageJ and normalized by the signals of H3. L, Lincomycin; M, mock.

