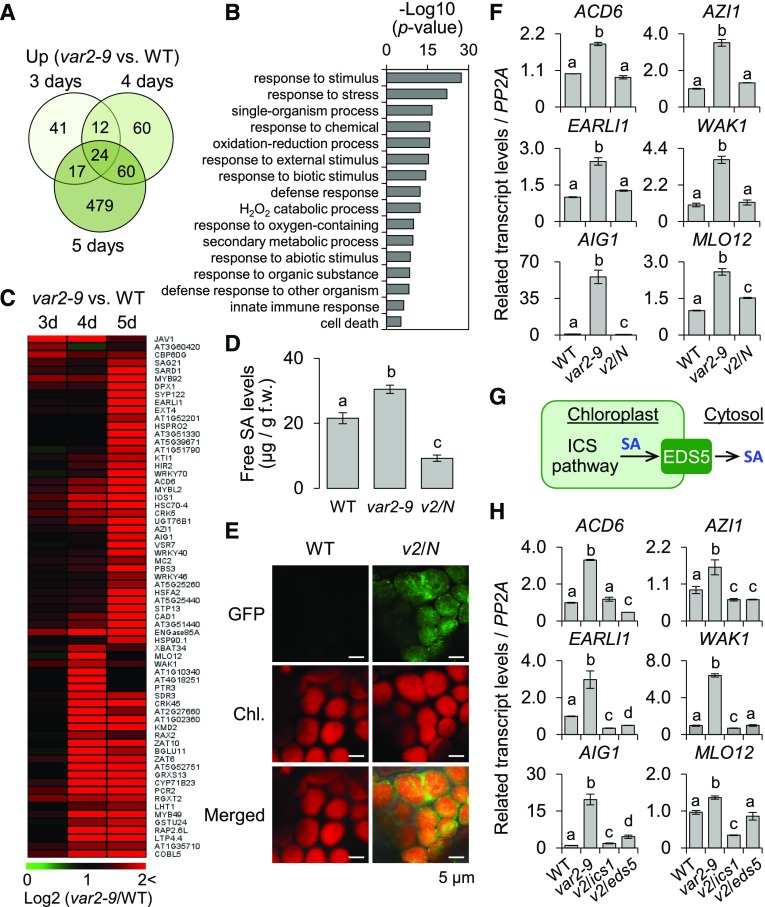
Figure 4.
SA synthesized via the chloroplast ICS pathway primes the expression of SA-responsive genes in the var2-9 mutant. For the genome-wide transcriptome analysis, 3-, 4-, and 5-d-old wild-type (WT) and var2-9 seedlings grown under CL (40 μmol m−2 s−1 at 22°C ± 2°C) were used. A, Up-regulation of immune-related genes in var2-9 seedlings after the onset of photosynthesis. The Venn diagram shows the number of genes with at least a twofold up-regulation in var2-9 compared with the wild type. B, Enriched GO terms in the biological process category indicate that stress-, immune-, and defense-related genes were significantly overrepresented in the up-regulated genes (A) in the var2-9 mutant. C, Heat map showing the expression levels of the SRGs in the var2-9 seedlings compared with the wild type. D, The endogenous levels of free SA in wild-type, var2-9, and var2-9 cpNahG (v2/N) seedlings were determined. The data represent means of three independent biological replicates for each genotype. Error bars indicate sd. f.w., Fresh weight. E, Localization of cpNahG-GFP in a young leaf cell of the var2-9 mutant (right). Confocal images taken from the young leaf cell of wild-type seedlings are shown as a control (left). Chl., Chlorophyll. F, The transcript abundances of selected SRGs, including Avrrpt2-induced gene1 (AIG1), Azelaic acid induced1 (AZI1), early Arabidopsis aluminum induced1 (EARLI1; a paralog of AZI1), Accelerated cell death6 (ACD6), Mildew resistance locus O12 (MLO12), and Wall associated kinase1 (WAK1), in 5-d-old wild type, var2-9, and v2/N seedlings were examined using reverse transcription quantitative PCR (RT-qPCR). G, Chloroplast ICS pathway and SA export to the cytosol via the EDS5 transporter. H, Five-day-old wild-type, var2-9, var2-9 ics1 (v2/ics1), and var2-9 eds5 (v2/eds5) seedlings were collected to analyze the transcript levels of SRGs using RT-qPCR. Gene expression levels shown in F and H are means ± sd of three independent biological samples. PROTEIN PHOSPHATASE2A (PP2A) was used as an internal control. Lowercase letters in D, F, and H indicate statistically significant differences between mean values (P < 0.05, one-way ANOVA with posthoc Tukey’s honestly significant difference [HSD] test).

