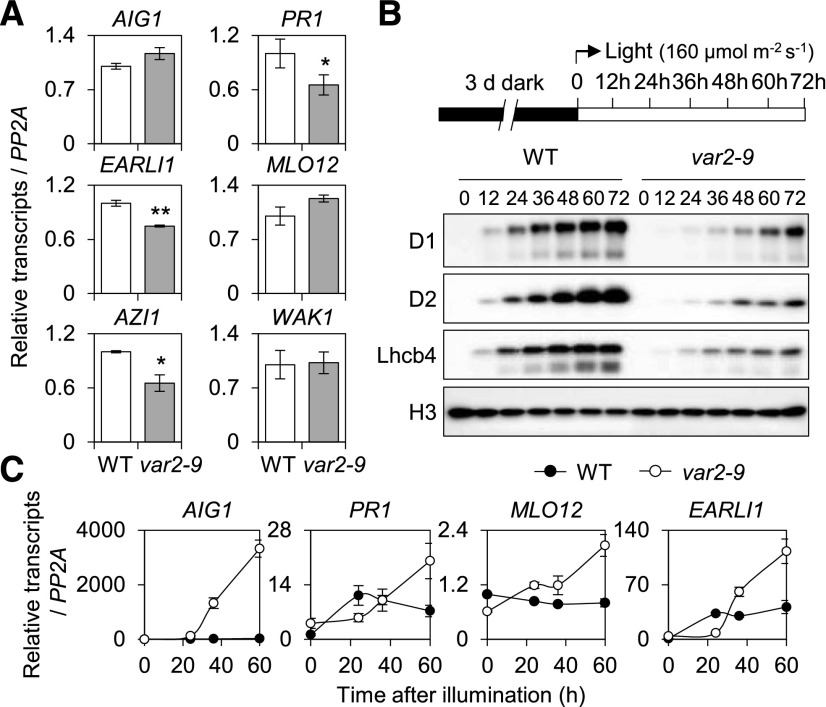
Figure 7.
Light is essential for the expression of SRGs in the var2-9 mutant. A, The transcript levels of selected SRGs (Fig. 4F) were determined in 5-d-old var2-9 and wild-type (WT) etiolated seedlings by RT-qPCR. The data represent means of three independent biological replicates. Error bars indicate sd. Asterisks indicate statistically significant differences (*, P < 0.05; **, P < 0.01) determined by Student’s t test relative to the wild type. B and C, Three-day-old etiolated seedlings were illuminated at the light intensity of 160 μmol m−2 s−1 at 22°C ± 2°C. Total RNA and protein were extracted at different time points as indicated. Accumulation of PSII proteins, such as D1, D2, and Lhcb4, during deetiolation was analyzed by immunoblot analysis (B), and the relative transcript levels of SRGs were determined by RT-qPCR (C). Gene expression levels are means ± sd of three independent biological samples. PP2A was used as an internal control. For immunoblot analysis, histone (H3) was used as a loading control.

