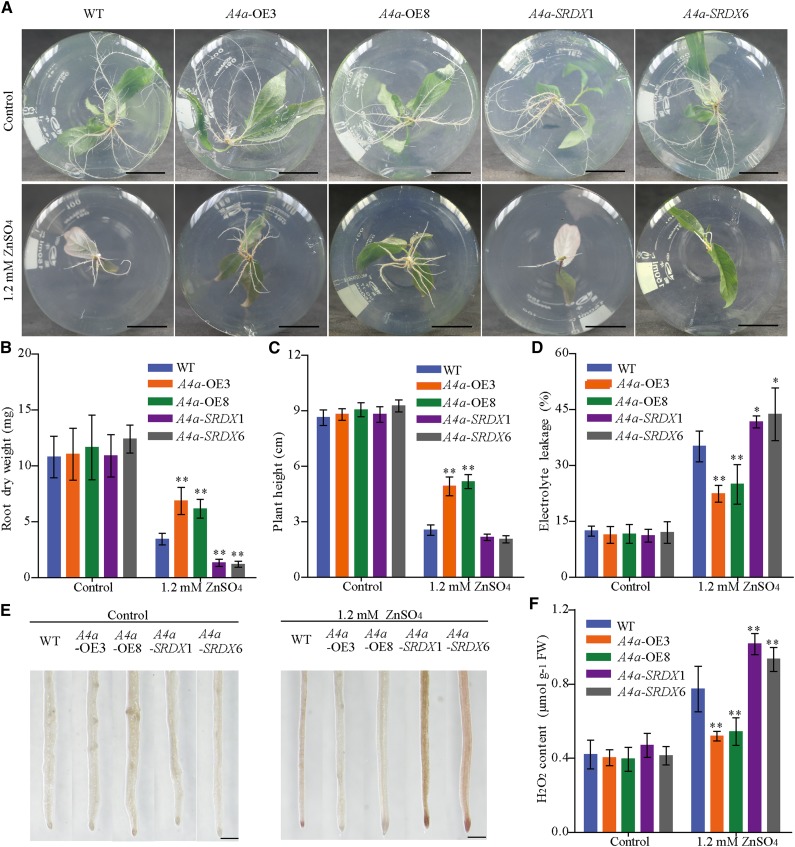
Figure 4.
Phenotypes of wild-type, PuHSFA4a-overexpression (A4a-OE3 and A4a-OE8), and PuHSFA4a-SRDX dominant repressor (A4a-SRDX1 and A4a-SRDX6) P. ussuriensis plants. A, Phenotypes of A4a-OE3, A4a-OE8, A4a-SRDX1, A4a-SRDX6, and wild-type (WT) plant roots grown with or without 1.2 mm of ZnSO4 for two weeks. Scale bars = 2 cm. B and C, Root dry weight (B) and plant height (C) of A4a-OE3, A4a-OE8, A4a-SRDX1, A4a-SRDX6, and wild-type plants with or without 1.2 mm of ZnSO4. Each value represents the mean of 30 plants, and error bars = sd. D, Measurement of EL in A4a-OE3, A4a-OE8, A4a-SRDX1, A4a-SRDX6, and wild-type plants with or without 1.2 mm of ZnSO4. Data are presented as means of six biological replicates, and error bars = sd. E and F, In situ accumulation of H2O2 in wild-type and transgenic plants, as revealed by histochemical staining with DAB with or without 1.2 mm of ZnSO4 (E). Scale bars = 500 µm. Measurement of the H2O2 content of roots in wild-type and transgenic plants by luminol assay as described in the “Materials and Methods” (F). Data are presented as means of three biological replicates, and error bars = sd. In (B), (C), (D), and (F), Asterisks indicate significant differences as determined by a Student’s t test, *P < 0.05 and **P < 0.01.

