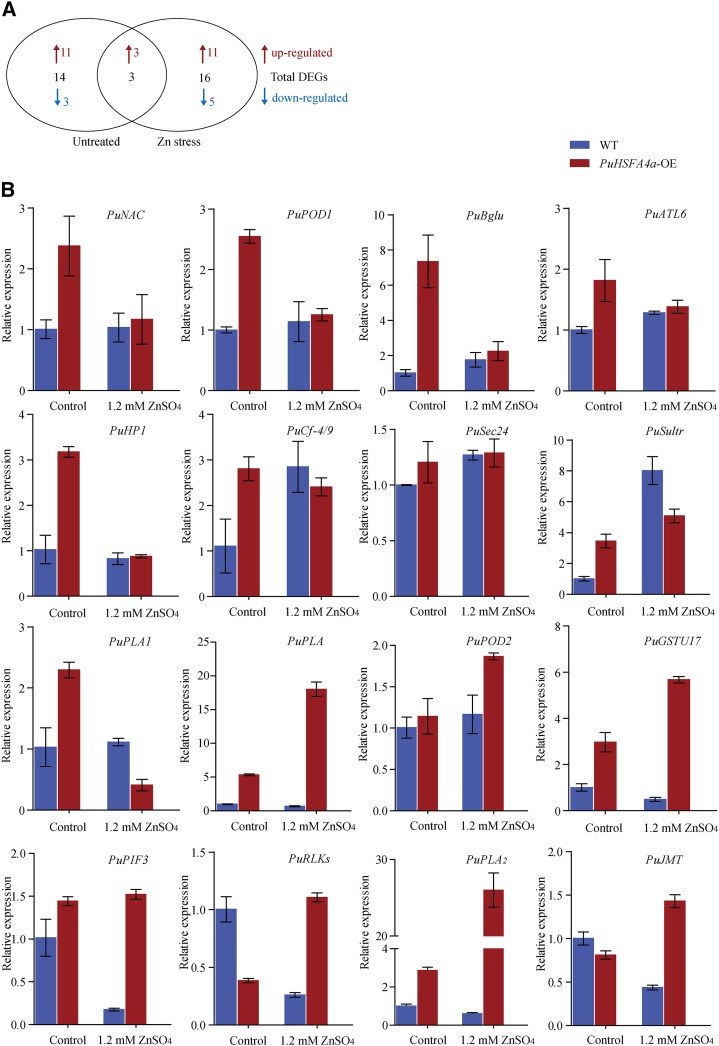
Figure 6.
Transcriptome analyses of PuHSFA4a overexpression and wild-type (WT) P. ussuriensis plants under high Zn stress. A, Venn diagrams comparing the DEGs among the PuHSFA4a-OE and wild-type P. ussuriensis lines with or without 1.2 mm of ZnSO4. “Untreated” represents the DEGs between wild-type and PuHSFA4a-OE under control conditions. “Zn stress” represents the DEGs between wild-type and PuHSFA4a-OE under high Zn stress. Red and blue colors indicate upregulated and downregulated genes, respectively. B, RT-qPCR analysis of the transcript levels of PuHSFA4a target genes with or without 1.2 mm of ZnSO4. Data are presented as means of three biological replicates, and error bars = sd.

