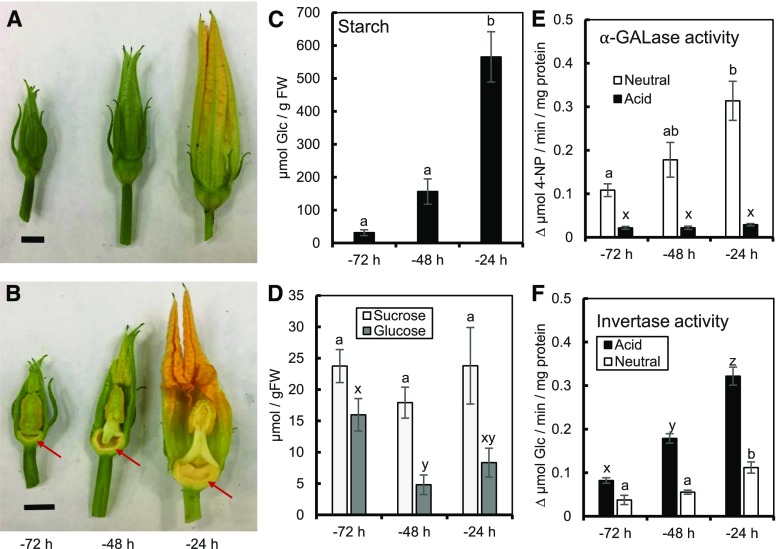
Figure 1.
Carbohydrate partitioning during the starch-filling stage in C. pepo nectaries. A and B, Example images of three developmental stages for whole (A) and dissected (B) flowers. Scale bars = 1 cm. Nectaries are denoted by an arrow in (B). C, Starch content in nectaries from −72 to −24 h before peak secretion. D, Levels of Suc and Glc in nectaries at the same time points. E, Neutral (pH 7.4) and acid (pH 5.5) ⍺-galactosidase (α-GALase) activity. F, Acid (pH 4.8) and neutral (pH 7) invertase activity (micromole Glc produced). For the activity assays, activity was normalized to total protein added (milligram protein). Bars that share a letter are not significantly different from one another (a, b, c were tested together; x, y, z were tested together; P < 0.05, Tukey post hoc test). Error bars represent SE (n = 4). 4-NP, 4-nitrophenol.

