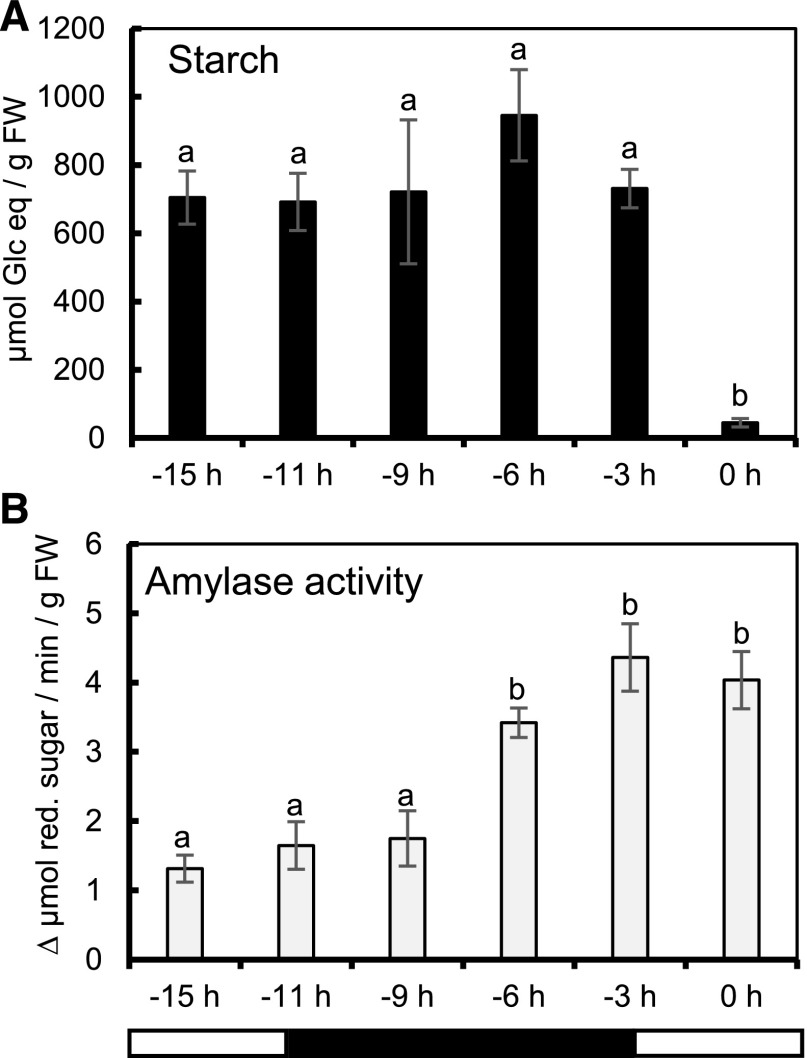
Figure 2.
Starch and sugar metabolism as nectaries progress toward nectar secretion. Starch (A) and total amylase activity [B; micromole reducing (red.) sugar produced] in nectaries are shown. Error bars represent SE (n = 8). Columns that share a letter are not significantly different from one another (Tukey post hoc test, P < 0.05). The bottom bar indicates light and dark periods.

