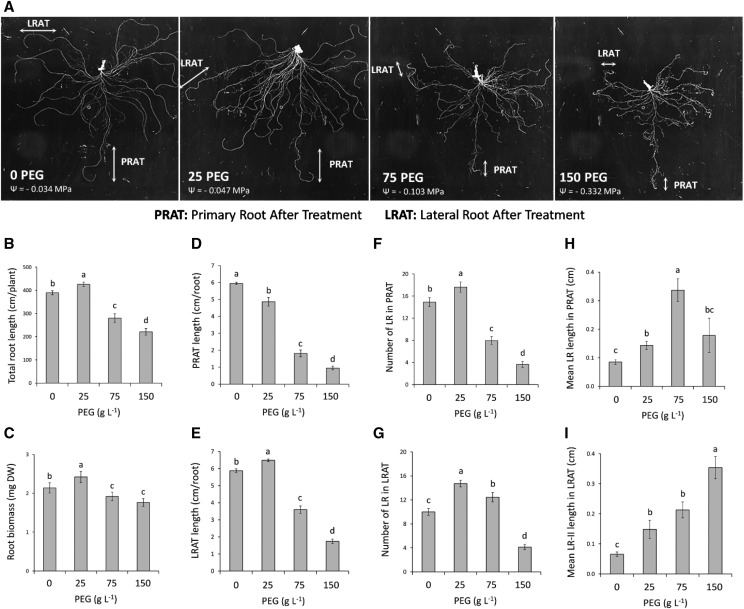
Figure 1.
Changes of RSA in response to WD. Plants were grown until 18 DAS in hydroponics under standard conditions and subjected for 5 additional d (23 DAS) to the indicated PEG-8000 treatments. A, Representative images showing the whole root system architecture, the parts of the PRAT, and the oldest LRAT used for specific analyses. B and C, Whole root systems were used to determine total root length (B) and biomass production (C) per plant. D to I, The length of the PRAT (D) and the LRAT (E), the number of LRs formed in the PRAT (F), the number of second-order LRs formed in the LRAT (G), the mean length of LRs formed in the PRAT (H), and the mean length of second-order LRs (LR-II) formed in the PRAT (I) per root are shown. Mean values ± se were obtained from plants grown in three independent experiments (n = 20–25). ‘Homogeneous group’ statistics were calculated through ANOVA, where mean values with different letters are significantly different according to lsd test at P ≤ 0.001.

