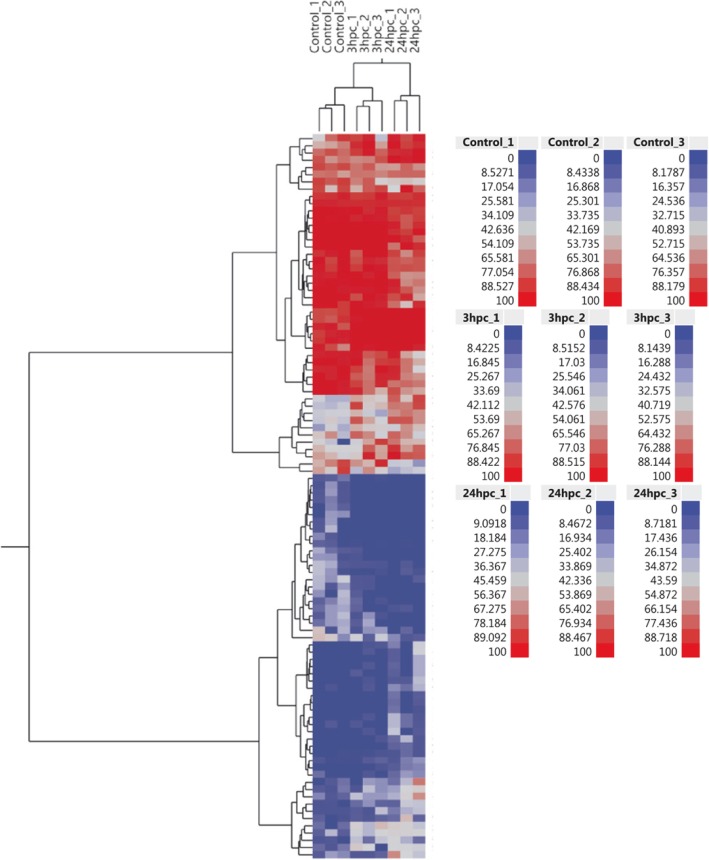
Fig. 4.
Heat map and hierarchical cluster analysis of the top 100 differentially methylated CpG identified in the study. The red colour in the heatmap indicates hypermethylated loci and the blue indicates hypomethylated loci. Hierarchical clustering dendrogram reveals distinct differential methylation patterns among different groups

