
Fig. 2.
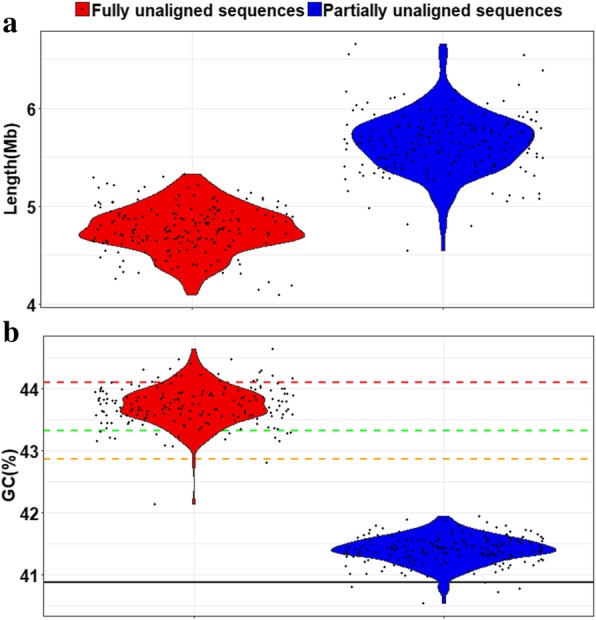
Summary of non-reference sequences for individual genomes. a The total length (Mb) and b the GC content (%) of unaligned contigs (including fully unaligned sequences and partially unaligned sequences) obtained for each individual after removing potential contamination. In b, the solid black line represents GC content of the primary sequence in GRCh38 (40.87%); the dotted lines represent GC content of novel sequences of YH genome [26] (red, 44.11%); 5.8 Mb novel contigs from SGDP [9] (green, 43.43%) and novel sequences of NA18507 genome (orange, 42.87%). The width of each plot indicates the frequency of samples with a given length or GC content