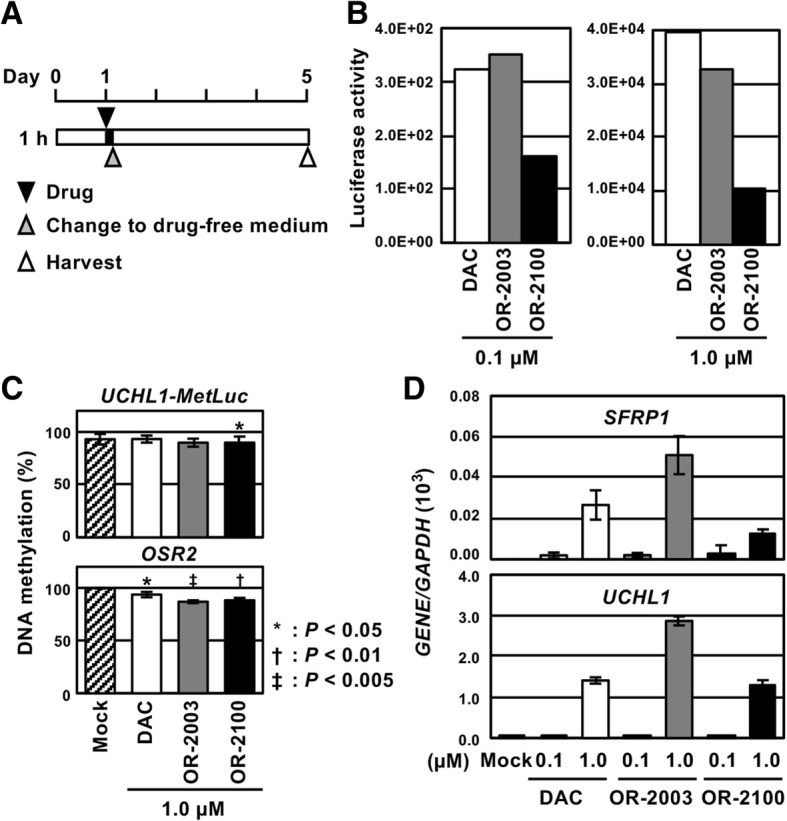
Fig. 4.

Effect of a pulse exposure of OR-2003 and OR-2100. a Treatment schedule of the pulse exposure analysis. HML58-3 cells were treated with 0.1 and 1.0 μM of DAC, OR-2003, and OR-2100, and the compounds were removed at 1 h by replacing the medium with drug-free medium. The effects were analyzed 5 days after the drug administration. b Luciferase activity due to marker gene demethylation. OR-2003 showed luciferase activity similar to that of DAC, whereas OR-2100 exhibited a luciferase activity weaker than that of DAC. c DNA demethylation of an exogenous marker gene and endogenous gene. Methylation levels were analyzed by qMSP in the drug-treated cells (1.0 μM). OR-2003 and OR-2100 induced stronger demethylation of these two genes compared with that induced by DAC. Values show mean ± SD of three experiments. d Reactivation of tumor-suppressor genes. The higher dose (1.0 μM) of all compounds induced expression of SFRP1 and UCHL1. The expression level induced by OR-2003 was twice as high as that induced by DAC. Each RT-qPCR analysis was performed thrice, and the results are represented as mean ± SD
