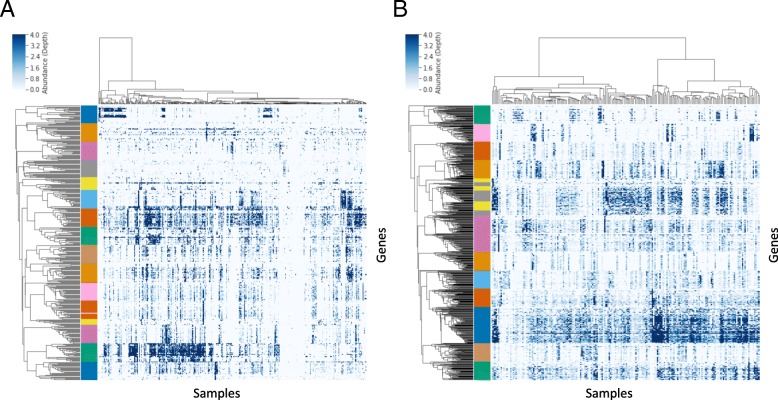
Fig. 1.
Patterns of gene-level co-abundance across all microbiome samples from a subset of CAGs. Each row represents a single microbial gene, each column represents a single biological sample, and pixel color reflects the gene’s relative abundance (sequencing depth) in the sample. A subset of CAGs and genes was randomly selected for display from the CRC datasets (a) and the IBD datasets (b). Unsupervised hierarchical clustering was used to group the rows and columns, and the left-hand color bar indicates the CAG assignment for each gene

