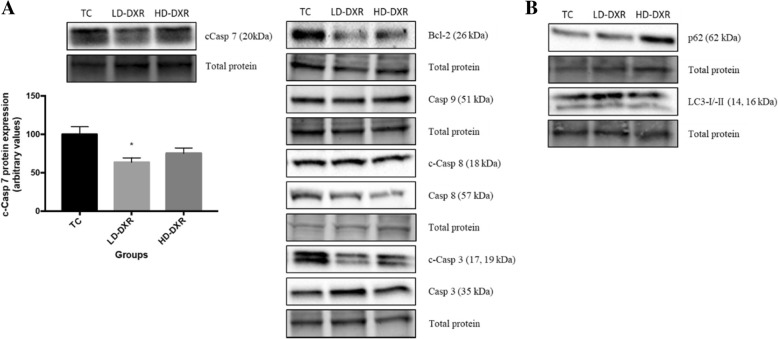
Fig. 2.
a Protein expression of c-Casp 7 between the TC, LD-DXR and HD-DXR groups (n = 8). * - significantly different compared to TC group (p < 0.05). Representative images of Bcl-2, Casp 9, c-Casp 8, Casp 8, c-Casp 3 and Casp 3 protein expression between the TC, LD-DXR and HD-DXR groups (n = 8). b Representative images of p62 and LC3-I/−II protein expression between the TC, LD-DXR and HD-DXR groups (n = 8)

