
Figure 6.
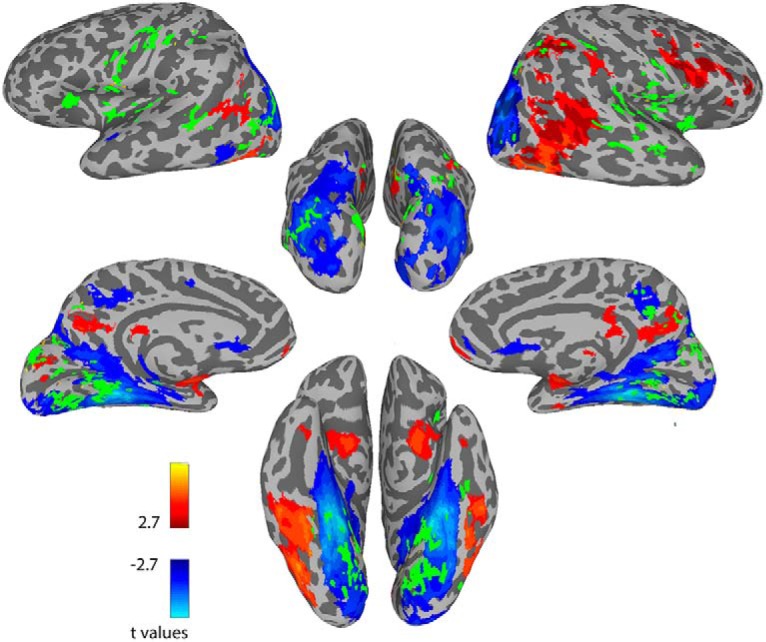
Overlap with the face network. Map shows the group level Faces > Scenes contrast, with face selective voxels shown in red, and scene selective voxels in blue. Map is thresholded at an FDR corrected value of q < 0.05. Overlaid in green is the conjunction map from the previous analysis which was shown in Figure 4, using the face ROIs as seeds. Note the lack of overlap between these face memory predictive voxels and the face network.