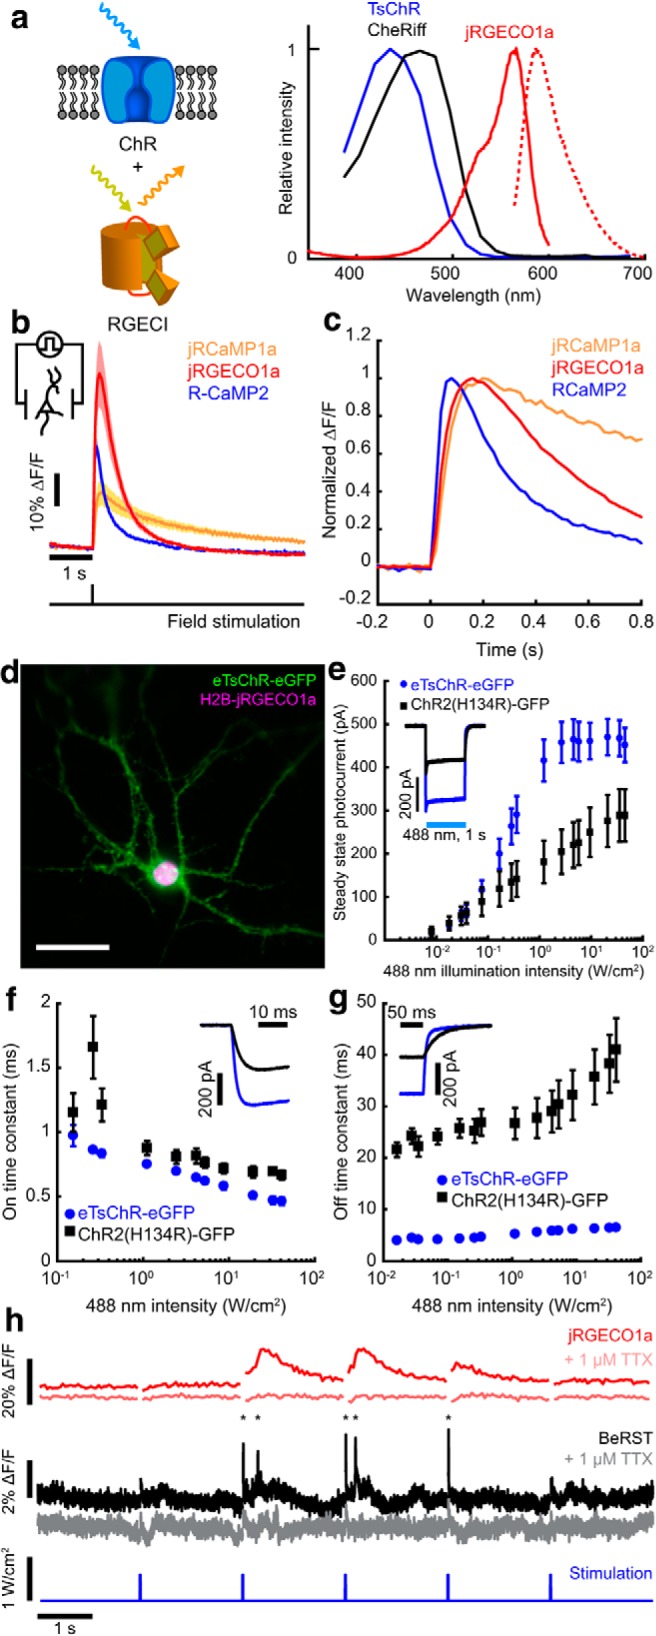
Figure 1.

All-optical neurophysiology with a blue-shifted channelrhodopsin and a red-shifted Ca2+ indicator. a, Left, Schematic of a spectrally orthogonal channelrhodopsin and RGECI. Right, Action spectra of proteins used in this work. Spectra are reproduced with permission from Dana et al., 2016 for jRGECO1a; Klapoetke et al., 2014 for TsChR; and Hochbaum et al., 2014 for CheRiff. b, Single action potential responses of RGECIs in cultured rat hippocampal neurons. Dark lines indicate the average of 3 FOVs, ∼30 cells/FOV, for R-CaMP2, and 4 FOVs for jRGECO1a and jRCaMP1a. Colored bands indicate ±SEM. Dishes were stimulated with 1 ms field stimulation pulses. RGECI fluorescence was recorded at 50 Hz. c, Kinetics of the RGECIs, shown by plotting data in b normalized to peak ΔF/F. d, Cultured hippocampal neuron coexpressing H2B-jRGECO1a (magenta) and eTsChR (green). Scale bar, 10 μm. e, Steady-state photocurrents of eTsChR and ChR2(H134R) in cultured neurons held at −65 mV (1 s pulses, 488 nm, n = 6 cells for each construct). Inset, Photocurrent response to 2 W/cm2 488 nm illumination. f, Channelrhodopsin activation time constant as a function of 488 nm illumination intensity. Inset, Photocurrents during illumination start. g, Closing time constants. Inset, Photocurrents during illumination stop. h, Optogenetic stimulation induced action potentials and corresponding fluorescence transients in a cultured neuron expressing jRGECO1a and eTsChR. Pulses of blue light (488 nm, 10 ms, 680 mW/cm2) drove action potentials (*), which were identified via fluorescence of a far-red voltage-sensitive dye, BeRST1 (1 μm, black; Huang et al., 2015). Fluorescence transients of jRGECO1a accompanied action potentials (red). TTX (1 μm) silenced activity in both the voltage (pink) and Ca2+ (gray) channels, confirming that signals arose from neural activity and not optical crosstalk. Voltage imaging was performed at 500 Hz with 0.7 W/cm2 640 nm light and calcium imaging was performed at 20 Hz with 1.1 W/cm2 561 nm light. All error bars indicate mean ± SEM.
