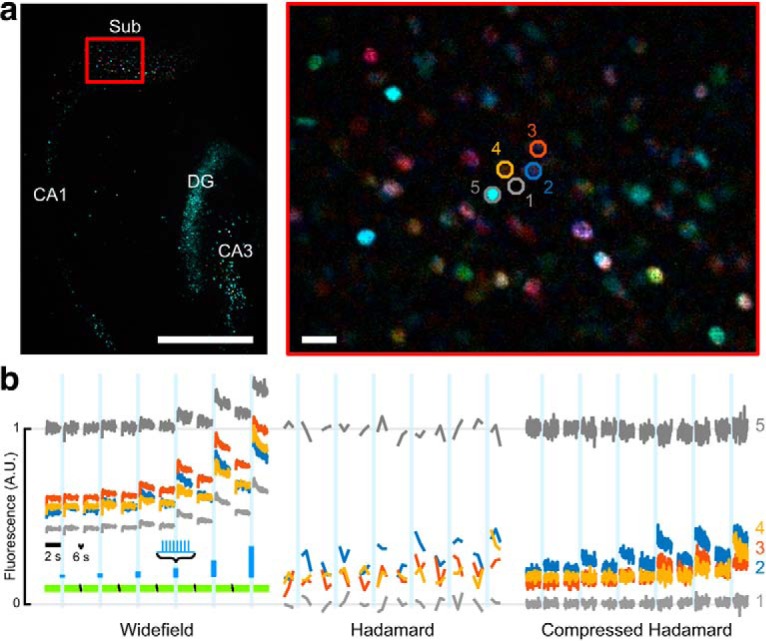
Figure 10.

High-speed wide-area all-optical neurophysiology using Compressed Hadamard Imaging. a, Left, PCA-colored map showing response of nuclear jRGECO1a to stepped optogenetic stimulation across the hippocampal formation. Sub, Subiculum; DG, dentate gyrus; CA1/CA3, cornu ammonis. Scale bar, 0.5 mm. Right, Magnified view of the cyan rectangle shows the location of a background region (1, gray), three responding cells (2–4, colored), and a bright, non-responding cell (5, gray). Scale bar, 20 μm. Color saturation was increased by 100% for display. b, Comparison of fluorescence traces extracted from ROIs in a from the same recording, using three different analyses. Amplitude was scaled to normalize the baseline intensity of the brightest ROI. Left, Wide-field data calculated as the sum of paired complementary patterns. Signals had a time resolution of 33 Hz, but included out-of-focus background. Camera framerate was 66 Hz. Middle, Conventional Hadamard analysis produced one optical section every 48 frames, possibly with errors because of changing cell intensities during the pattern period. Right, Compressed Hadamard analysis obtained high-speed optically sectioned movies with 33 Hz framerate. Both Hadamard optical sections show a zero-centered value for the background ROI (1) and flat brightness for a non-responding cell (5), but distinct optogenetic activation thresholds for each responding cell (2–4).
