Figure 2.
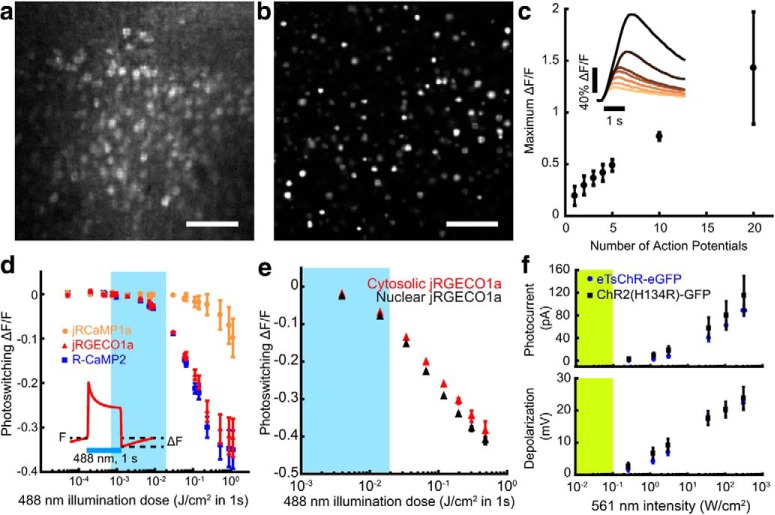
Characterization of soma-localized RGECIs and eTsChR. a, b, Maximum intensity projections of Hadamard z-stacks from acute cortical slices prepared from mice injected with (a) cytosolic AAV1-syn-NES-jRGECO1a or (b) nuclear-targeted AAV9-syn-DO-H2B-jRGECO1a. Scale bars, 100 μm. c, Maximum ΔF/F of H2B-jRGECO1a fluorescence versus number of evoked action potentials in cultured neurons, stimulated via current injection (n = 3 cells). Inset: example responses to increasing numbers of action potentials. d, Blue light induced photoswitching of cytosolic RGECIs in HEK293T cells under basal Ca2+ levels. RGECI fluorescence was recorded at 50 Hz with illumination at 561 nm, 80 mW/cm2. Blue illumination (1 s pulses, 488 nm) was added to the yellow illumination. Photoswitching was quantified as the decrease in fluorescence following blue light illumination compared with the initial fluorescence (inset); n = 3 FOV, ∼50 cells/FOV, for each construct. e, Comparison of photoswitching in cytosolic and nuclear-localized jRGECO1a. Blue bar represents range of illumination doses used for optogenetic stimulation in this study. f, Activation of channelrhodopsins as a function of 561 nm illumination intensity. Top, Steady-state photocurrents in cultured neurons voltage-clamped at −65 mV. Bottom, Voltage depolarization under current-clamp with an initial potential of −65 mV. Yellow bar indicates typical jRGECO1a imaging intensities. Acquired from cultured rat hippocampal neurons; n = 6 for each construct. All error bars indicate mean ± SEM.

