Figure 4.
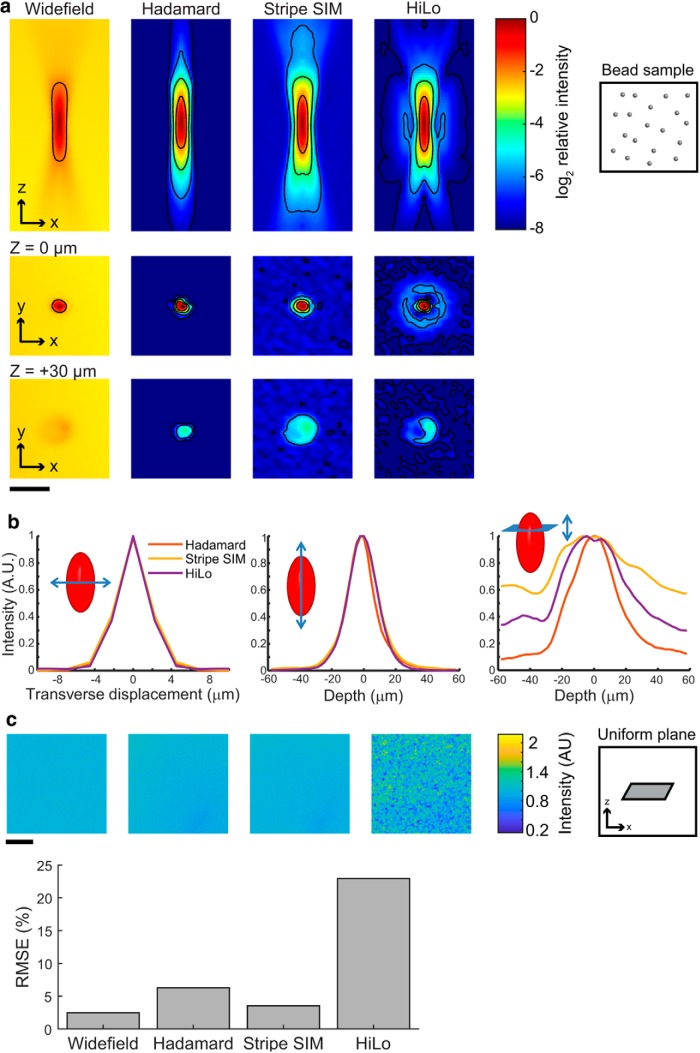
Characterization of Hadamard microscopy. a, b, Comparison of SIM optical sectioning methods using subdiffraction beads. a, Images show (left to right): wide-field epifluorescence, Hadamard microscopy using 12 patterns, stripe SIM with period 4 pixels and four phases, and HiLo microscopy using DMD-projected pseudorandom patterns. Top row, Radially averaged meridional cross-section of the PSF. Second row, Transverse cross-section at the focal plane. Third row, Transverse cross-section at 30 μm defocus. For all a panels, the color scale is logarithmic, and contours were drawn on every fourfold change in intensity. Scale bar, 20 μm, isotropic. b, Left and center, Lateral and axial line profiles through the PSF show equivalent resolution for the three sectioning methods. Right, Integrated intensity in transverse cross-sections reveals off-axis spurious side lobes in stripe SIM and HiLo which contribute to out-of-focus crosstalk. c, A uniform fluorescent plane at the focal plane resulted in larger inhomogeneities when imaged using HiLo in comparison with the other methods, a consequence of inhomogeneities in HiLo illumination (Mazzaferri et al., 2011). The fractional noise in HiLo did not decrease with increasing photon counts. Top, Optical section images of the uniform plane, all shown at the same linear color scale. Bottom, Deviations from uniformity in the images on top. Hadamard and stripe SIM microscopies avoided this artifact by providing illumination whose time-average intensity was precisely the same at all sample points. Scale bar, 200 μm. For all panels, each sample was imaged in matched conditions for all methods (number of images, illumination intensity, acquisition time). Detailed description in Materials and Methods.

