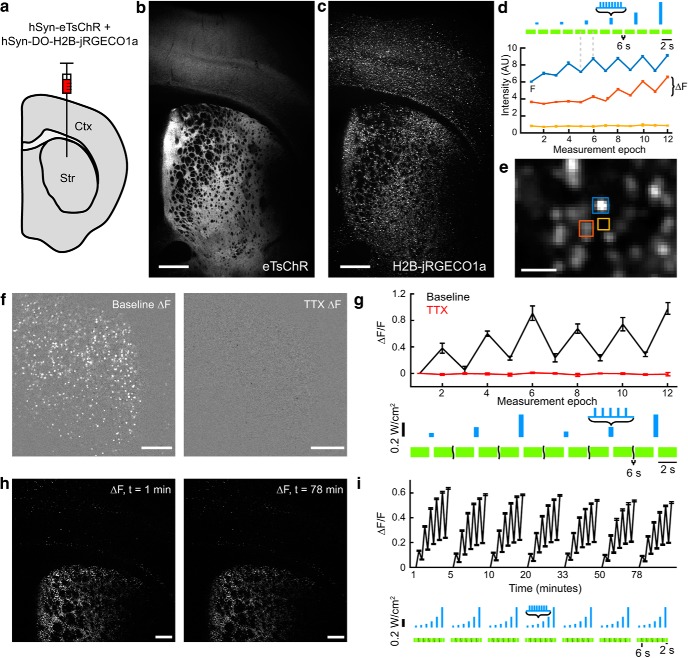
Figure 6.
Robust AON in acute brain slices. (a) AAV9 viruses coding for hSyn-eTsChR and hSyn-DO-H2B-jRGECO1a were co-injected in neonatal mouse cortex and striatum. (b) Maximum intensity projection of a Hadamard z-stack of eTsChR expression in a coronal corticostriatal slice from a P21 mouse. (c) Same as (b) in the H2B-jRGECO1a channel. (d) Fluorescence traces from regions indicated in (e). Two cells showed optogenetically induced fluorescence transients, while a region between the cells showed no signal. Here the sets of 11 images acquired before and after each optogenetic stimulus were averaged to form single pre- and post-stimulus fluorescence values. Error bars represent s.e.m. over n = 11 Hadamard images. Scale bar 25 μm. F is defined as the average intensity of the first imaging epoch and ΔF is the signal increase following blue light stimulation. (e) Magnified view of (c) showing single-cell resolution. (f) Mean ΔF images from striatum before (left) and after (right) addition of TTX (1 ΔM). Images are scaled identically. (g) Mean ΔF/F per measurement epoch from n = 360 cells in (f) before TTX addition (black) and after TTX addition (red). Blue light stimulation consisted of 5 pulses at 12.5 Hz of 488 nm light at 60, 120, and 300 mW/cm2, repeated twice. (h) One slice was repeatedly stimulated and imaged over 78 minutes with protocol in Fig. 3. Mean ΔF images from first run (left) and last run (right), scaled identically. (i) Average ΔF/F per measurement epoch for n = 3,195 cells in each run in slice shown in (h). Unless otherwise stated, all scale bars 250 μm. Error bars indicate ± SEM.

